
Open access coverage Funding trends and forecasts Research and publication output Online Media Campaign
A glimpse into the future of immunization research
This Research Strategy Data Snapshot, 'A glimpse into the future of immunization research' explores past trends as well as predictions for the future, based on high quality trusted data. This includes:
- Open access coverage
- The number of clinical trials
- Funding trends and forecasts
- Research and publication output
This project was undertaken in spring 2022 to support World Immunisation Week.

Online Media Campaign
Going big on nanotechnology
Demonstrating our competencies with research data is fundamental for enticing users into our research intelligence ecosystem. Creating marketing material with visually-rich insights into an emerging research area can help attract new audiences and direct online traffic towards the Nature Research Intelligence microsite.
Using Nature Index data from 2015 to 2021, visualisations were used to highlight the significant research growth experienced in the field of nanotechnology, revealing the leading institutions publishing in this landscape. The data analysis concludes with a view of high-profile collaborations on nanotechnology research at a country and entity level.
Conference Attendance Marketing
How AI can refine your SDG Research Strategy
This project was undertaken to support attendance at the 2023 INORMS (The International Network of Research Management Societies) Congress in June 2023.
Using the Dimensions database to draw out climate action publications over a ten-year period, the data analysis uncovered the leading fields of research (FoR) based on research productivity and relative citation ratio metrics, an international spread of climate action research and a dynamic ranking of the key funders for climate action research projects.

Online Media Campaign
Global Food Security: Sowing the seed of collaboration
This Nature Research Intelligence (NRI) postcard was developed specifically for the 2023 Association of Public and Land-Grant Universities (APLU) Annual Meeting to empower our sales teams with a dynamic tool for engaging conversations.
This postcard serves as a conversation starter and is designed to showcase our advanced analytical capabilities and demonstrate how artificial intelligence (AI) can play a pivotal role in driving informed strategic decisions within the research community.

Conference Attendance Marketing
European Association of Research Managers and Administrators
By equipping research offices with clear, actionable insights, this material strengthens early conversations and highlights how our tools align with global efforts to advance SDG 3 and foster high-impact, collaborative research.
Designed to spotlight our product’s strengths, the flyer showcases how Nature Navigator and the wider Nature Research Intelligence suite help research managers make confident, data-driven decisions. Through advanced machine learning and topic modelling, our tools provide insights into funding landscapes, collaboration networks, and emerging research themes—critical for maximizing the strategic impact of public health research.

Experimental Visualisations Proof-of-Concept
Analysing Citation Topic Trends to identify growth opportunities for Springer Nature
Understanding subject trends in the market can enable us to identify growth opportunities for Springer Nature. Topics that have reached a certain volume of publications, are growing and where we lag in market share are areas of opportunity, for example for topical collections or journal launches.
In late 2023 we added citation topics developed by the Core Data Science team to the Article Market Tracker to provide an additional route for users to look at subject trends in the article market. We have performed our own analysis of this data, as a proof-of-concept work to equip us with data-driven insights to:
- Identify emerging research areas where we can improve our presence.
- Allocate resources more effectively to growing topics
- Develop targeted strategies where a focus could yield significant benefits
- Benchmark our performance against competitors and industry trends.

Summary Report
The Management of River Water: Politician's Report
NRI were asked to produce a client-facing project that
highlighted water management research in the EU, presenting
the initiatives being taken to improve the quality of river
water across a selection of the highest performing river
basins in Europe. The project's summary report
(‘politician’s report’) discussed here condenses the
project’s full technical report (‘expert report’) into key
project insights and recommendations for consideration by
decision makers.
This shorter report was enriched by carefully curated
data visualisations, helping readers to quickly digest a
breadth of data points and gain insights into the publishing
trends, key actors and grant funding flows of water
management research in the EU, along with subject and
geographic classifications of the project case studies.

Full Report
The innovation and collaboration landscape in China - opportunities, risks and future engagement
A mixed methods scoping study on China’s research
commercialisation and innovation landscape. The study aims
to build a robust evidence base on China’s innovation
capabilities, explore current opportunities and barriers for
international collaboration, and identify thematic
priorities for UK-China engagement, and ultimately for the
benefit of the UK economy.

Prototype Benchmarking Competitor Analysis Bubble Chart
Competitor Analysis/Topic Benchmarking
This prototype visualisation presents a bubble chart as a
mechanism for evaluating a individual company's performance
against their main competitors using a range of available
metrics.

Full Report
Sharjah NEXT: Healthcare
A visually rich, compelling report into how Sharjah, in the
UAE, is shaping the future of healthcare with world-class
collaborators. This report was designed collaboratively
between Nature Research Intelligence (NRI), Nature Custom
Media (NCM) and the Sharjah Research Technology and
Innovation Park and distributed to attendees at Sharjah Next
Healthcare - a premier forum dedicated to exploring
cutting-edge technologies and research in the healthcare
sector.
Prototype Hierarchy Dendritic Tree
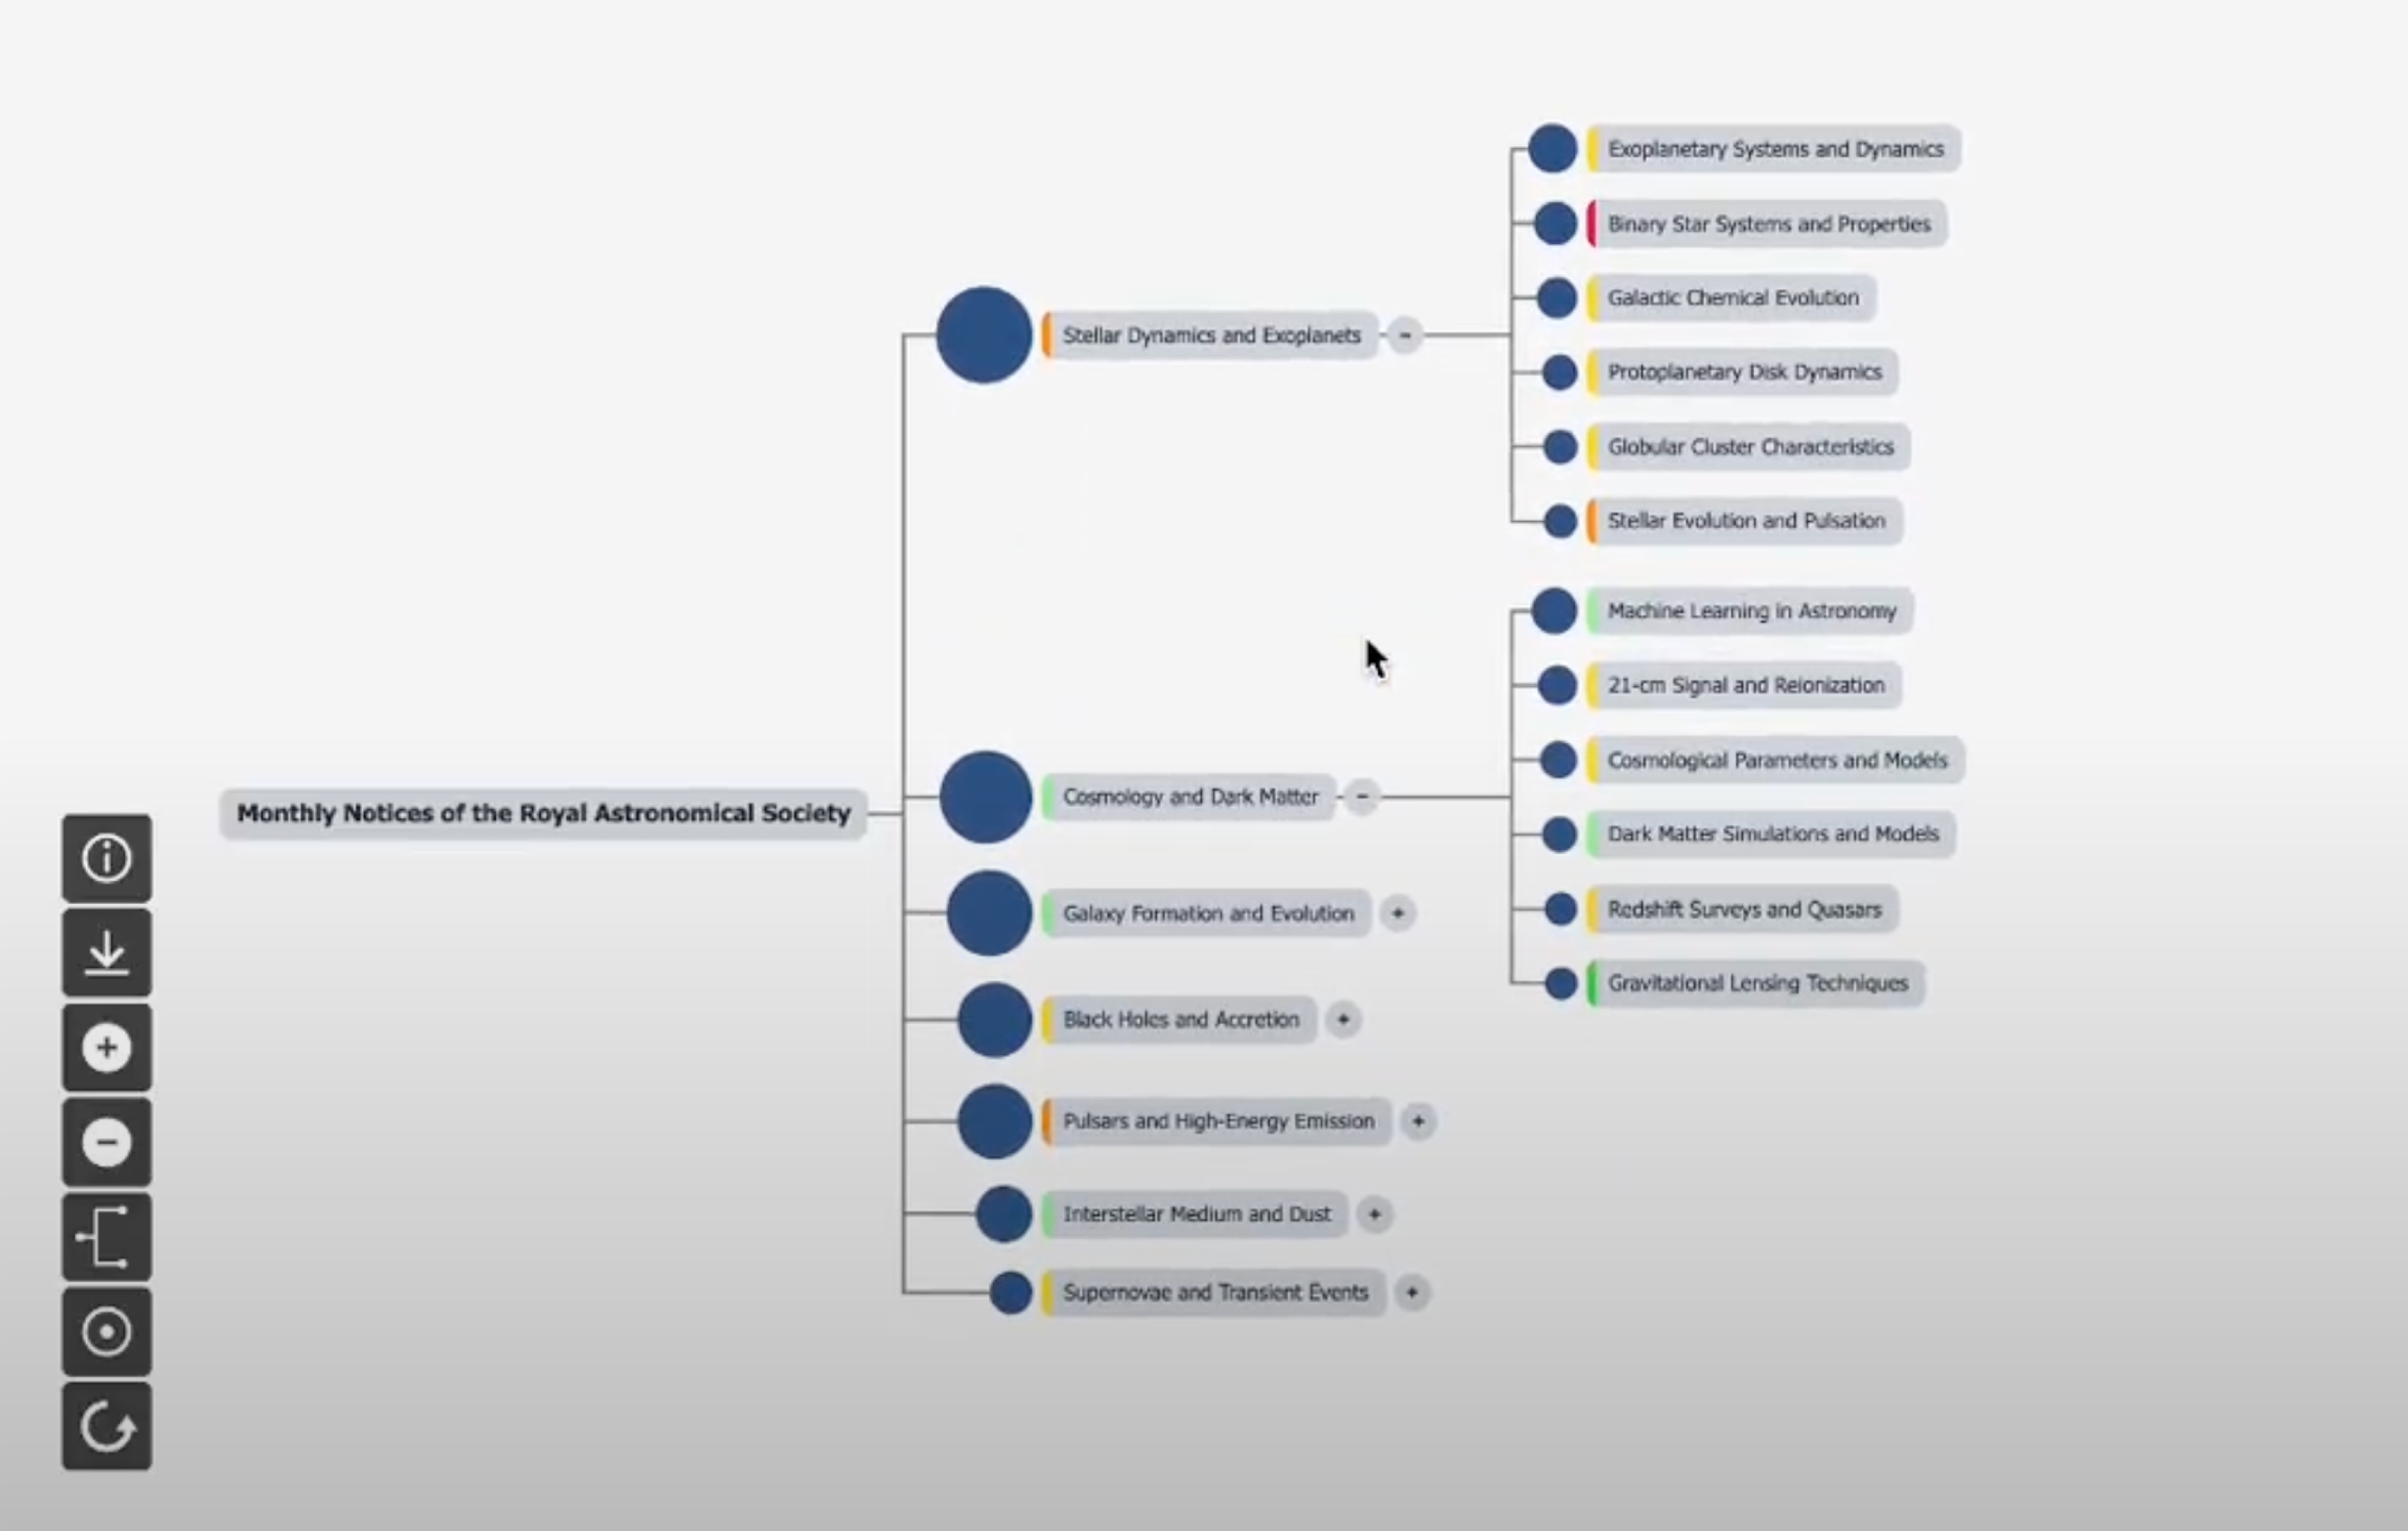
Topic anatomy for multi-document analysis
Vibe-coding is used to develop a usable interactive graph hierarchical dendritic tree visualisation to assist users in exploring and better understanding results from their submission to a new MCP-driven multi-document topic anatomy summarisation tool.
Aided by this visualisation, we introduce on-demand topic anatomies, a method that transforms a chosen corpus into a hierarchical map of topics and subtopics using machine-extracted keywords. It is configurable, currently works for publications, and readily extends to other document types. Available in an interactive UI and as MCP-native tools (Model Context Protocol), this serves as a concrete case of agents running a multi-step ML workflow, in contrast to typical tool use limited to simple retrieval.
Note: This article details the design process, decisions, and user functionality and interaction found implemented in the visualisation. For information on the underlying MCP-driven summarisation tool itself, please visit here.

Annual Review
Impact Solutions 2025 End-Of-Year Review In Numbers
The data visualisation project presented beyond this panel is an infographic developed specifically for the Division’s End of Year Review, designed to both retrospectively reflect on the past 12 months and to look ahead to the year to come. Its primary purpose is to provide a clear, visually engaging summary of key successes achieved by individual teams across the Division, distilling complex activity and performance into an accessible, high-level overview. By bringing these achievements together in a single, coherent visual format, the infographic supports shared understanding, celebration of progress, and strategic reflection.
See our data in a new light


Nature Research Intelligence
Data & Analytics Solutions
© 2024 Springer Nature Limited