Analysing Citation Topic Trends to identify growth opportunities for Springer Nature
Published
August 2024
Contributors
Ayushi Singh (ACE - Data Analyst)
Peter Bevan (Data and Analytics Solutions - Data Analyst)
Alison Mercer (Data and Analytics Solutions - Machine Learning Engineer)
Gard Jenset (ACE - Principal Data Scientist)
Daren Howell (Research Intelligence - VP)
Understanding subject trends in the market can enable us to identify growth opportunities for Springer Nature. Topics that have reached a certain volume of publications, are growing and where we lag in market share are areas of opportunity, for example for topical collections or journal launches.
In late 2023 we added citation topics developed by the Core Data Science team to the Article Market Tracker to provide an additional route for users to look at subject trends in the article market. We have performed our own analysis of this data, as a proof-of-concept work to equip us with data-driven insights to:
- Identify emerging research areas where we can improve our presence.
- Allocate resources more effectively to growing topics
- Develop targeted strategies where a focus could yield significant benefits
- Benchmark our performance against competitors and industry trends.
We analysed 11 citation topics out of 1,418 Level 3 citation topics using publication data from the Article Market Tracker dataset. The topics selected met three criteria:
- The topics demonstrated growth in the overall market over the past five years
- Topics have reached a minimum size, based on the volume being greater than 0.01% of the total number of articles published.
- Growth in the number of articles published by Springer Nature in these areas is not on par with the broader market trends.
As this is a 'proof-of-concept' piece of work, effort has
been made to ensure harmonisation and consistency is provided in
and across all visualisations, and also to allow testing of new
chart design ideas.
All charts adhere only in a limited capacity to Springer Nature
brand style design rules. As such, they have not been created
for disseminating outside of Springer Nature.
For future phases of this work, we will ensure any visualisation
intended for public consumption will aim to align more
rigorously with our company brand style guidelines.
The same colour set has been used throughout these
visualsiations to encode different publishing companies, to
maintain consistency and harmonisation acorss all content
produced.
.
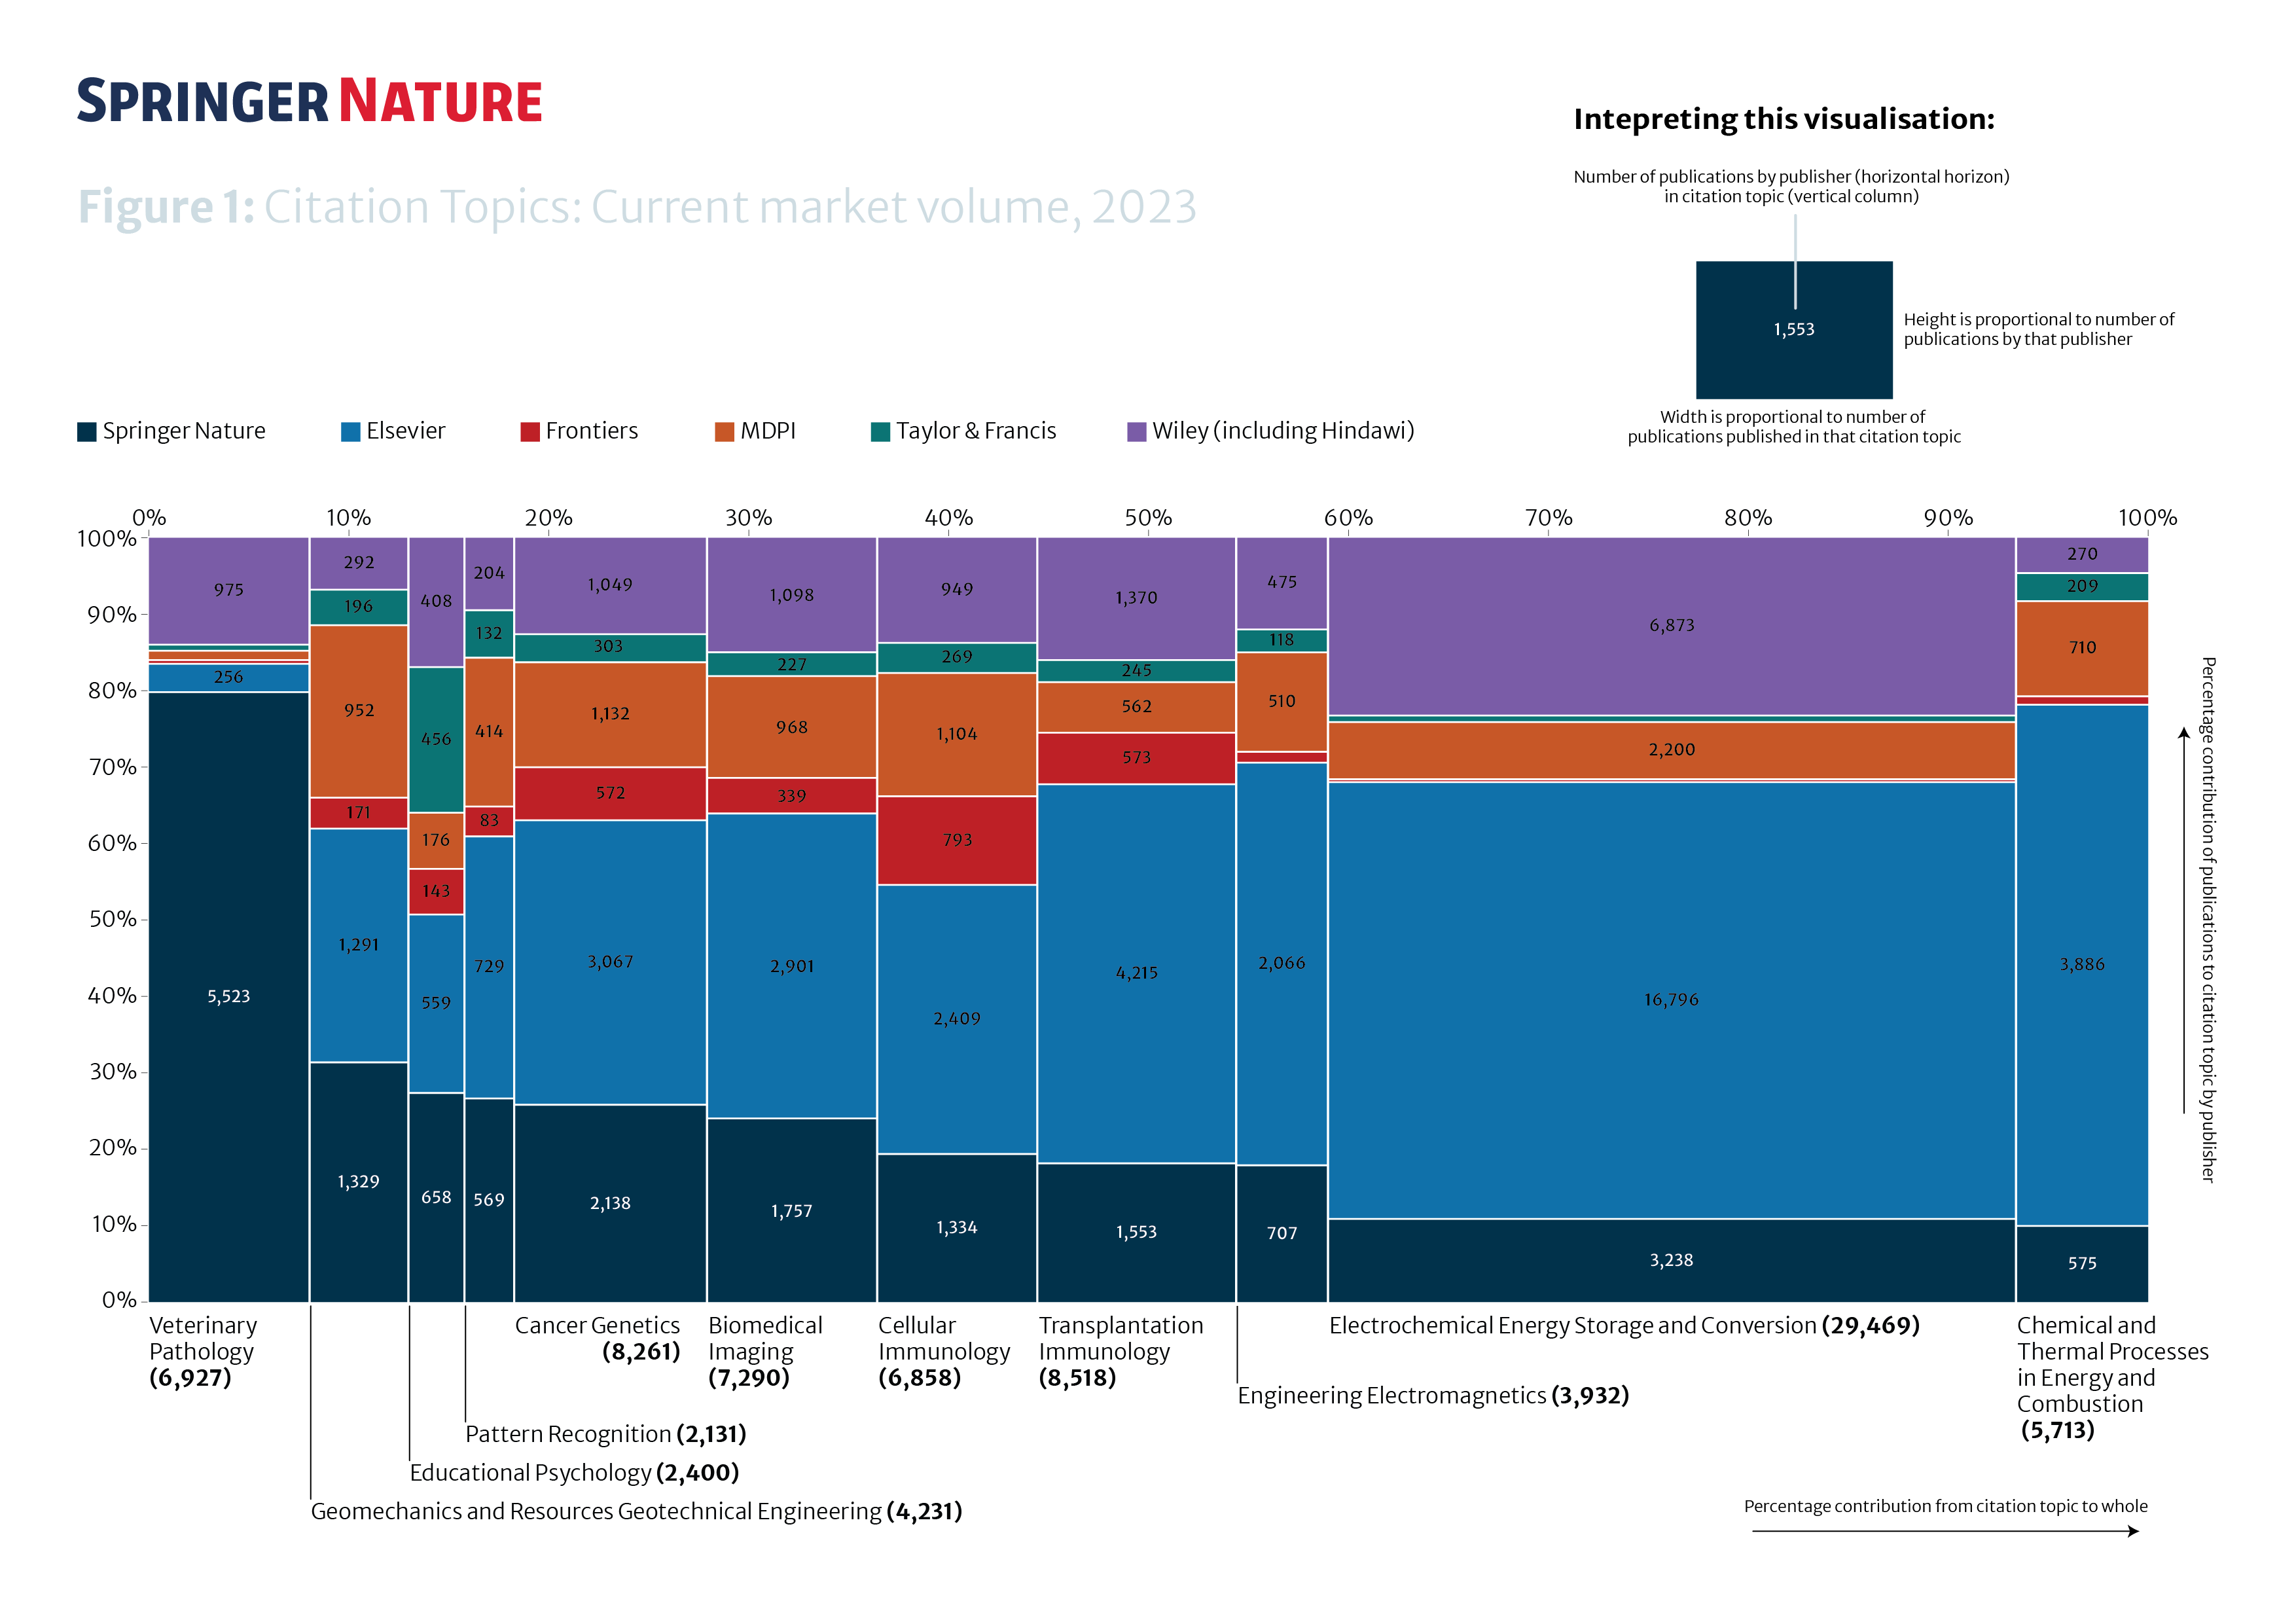
A Marimekko chart uses stacked column charts of variable widths
to represent and display categorical data graphically. In this
chart type, both cartesian axes feature variables with
percentages. The percentage scale of each segment determines
their height and width.
The Marimekko chart shown in Figure 1 shows current market
contribution across the selected citation topics compared with
our competitors and so shows areas of opportunity for Springer
Nature.The width of the bars in the chart is proportional to the
2023 market volume of articles while the height of the bars is
proportional to the market share of each publisher. Springer
Nature is encoded using Dark Blue and competitor publishers are
each encoded using a constant single colour throughout all
visualisations presented for consistency and harmoinsation. For
instance on the citation topic
Chemical and Thermal Processes in Energy and Combustion,
which we will focus on as an example throughout the HIVE post,
the chart shows this is the topic we have the lowest market
share of from the 11, with Elsevier and MDPI publishing most in
this space.

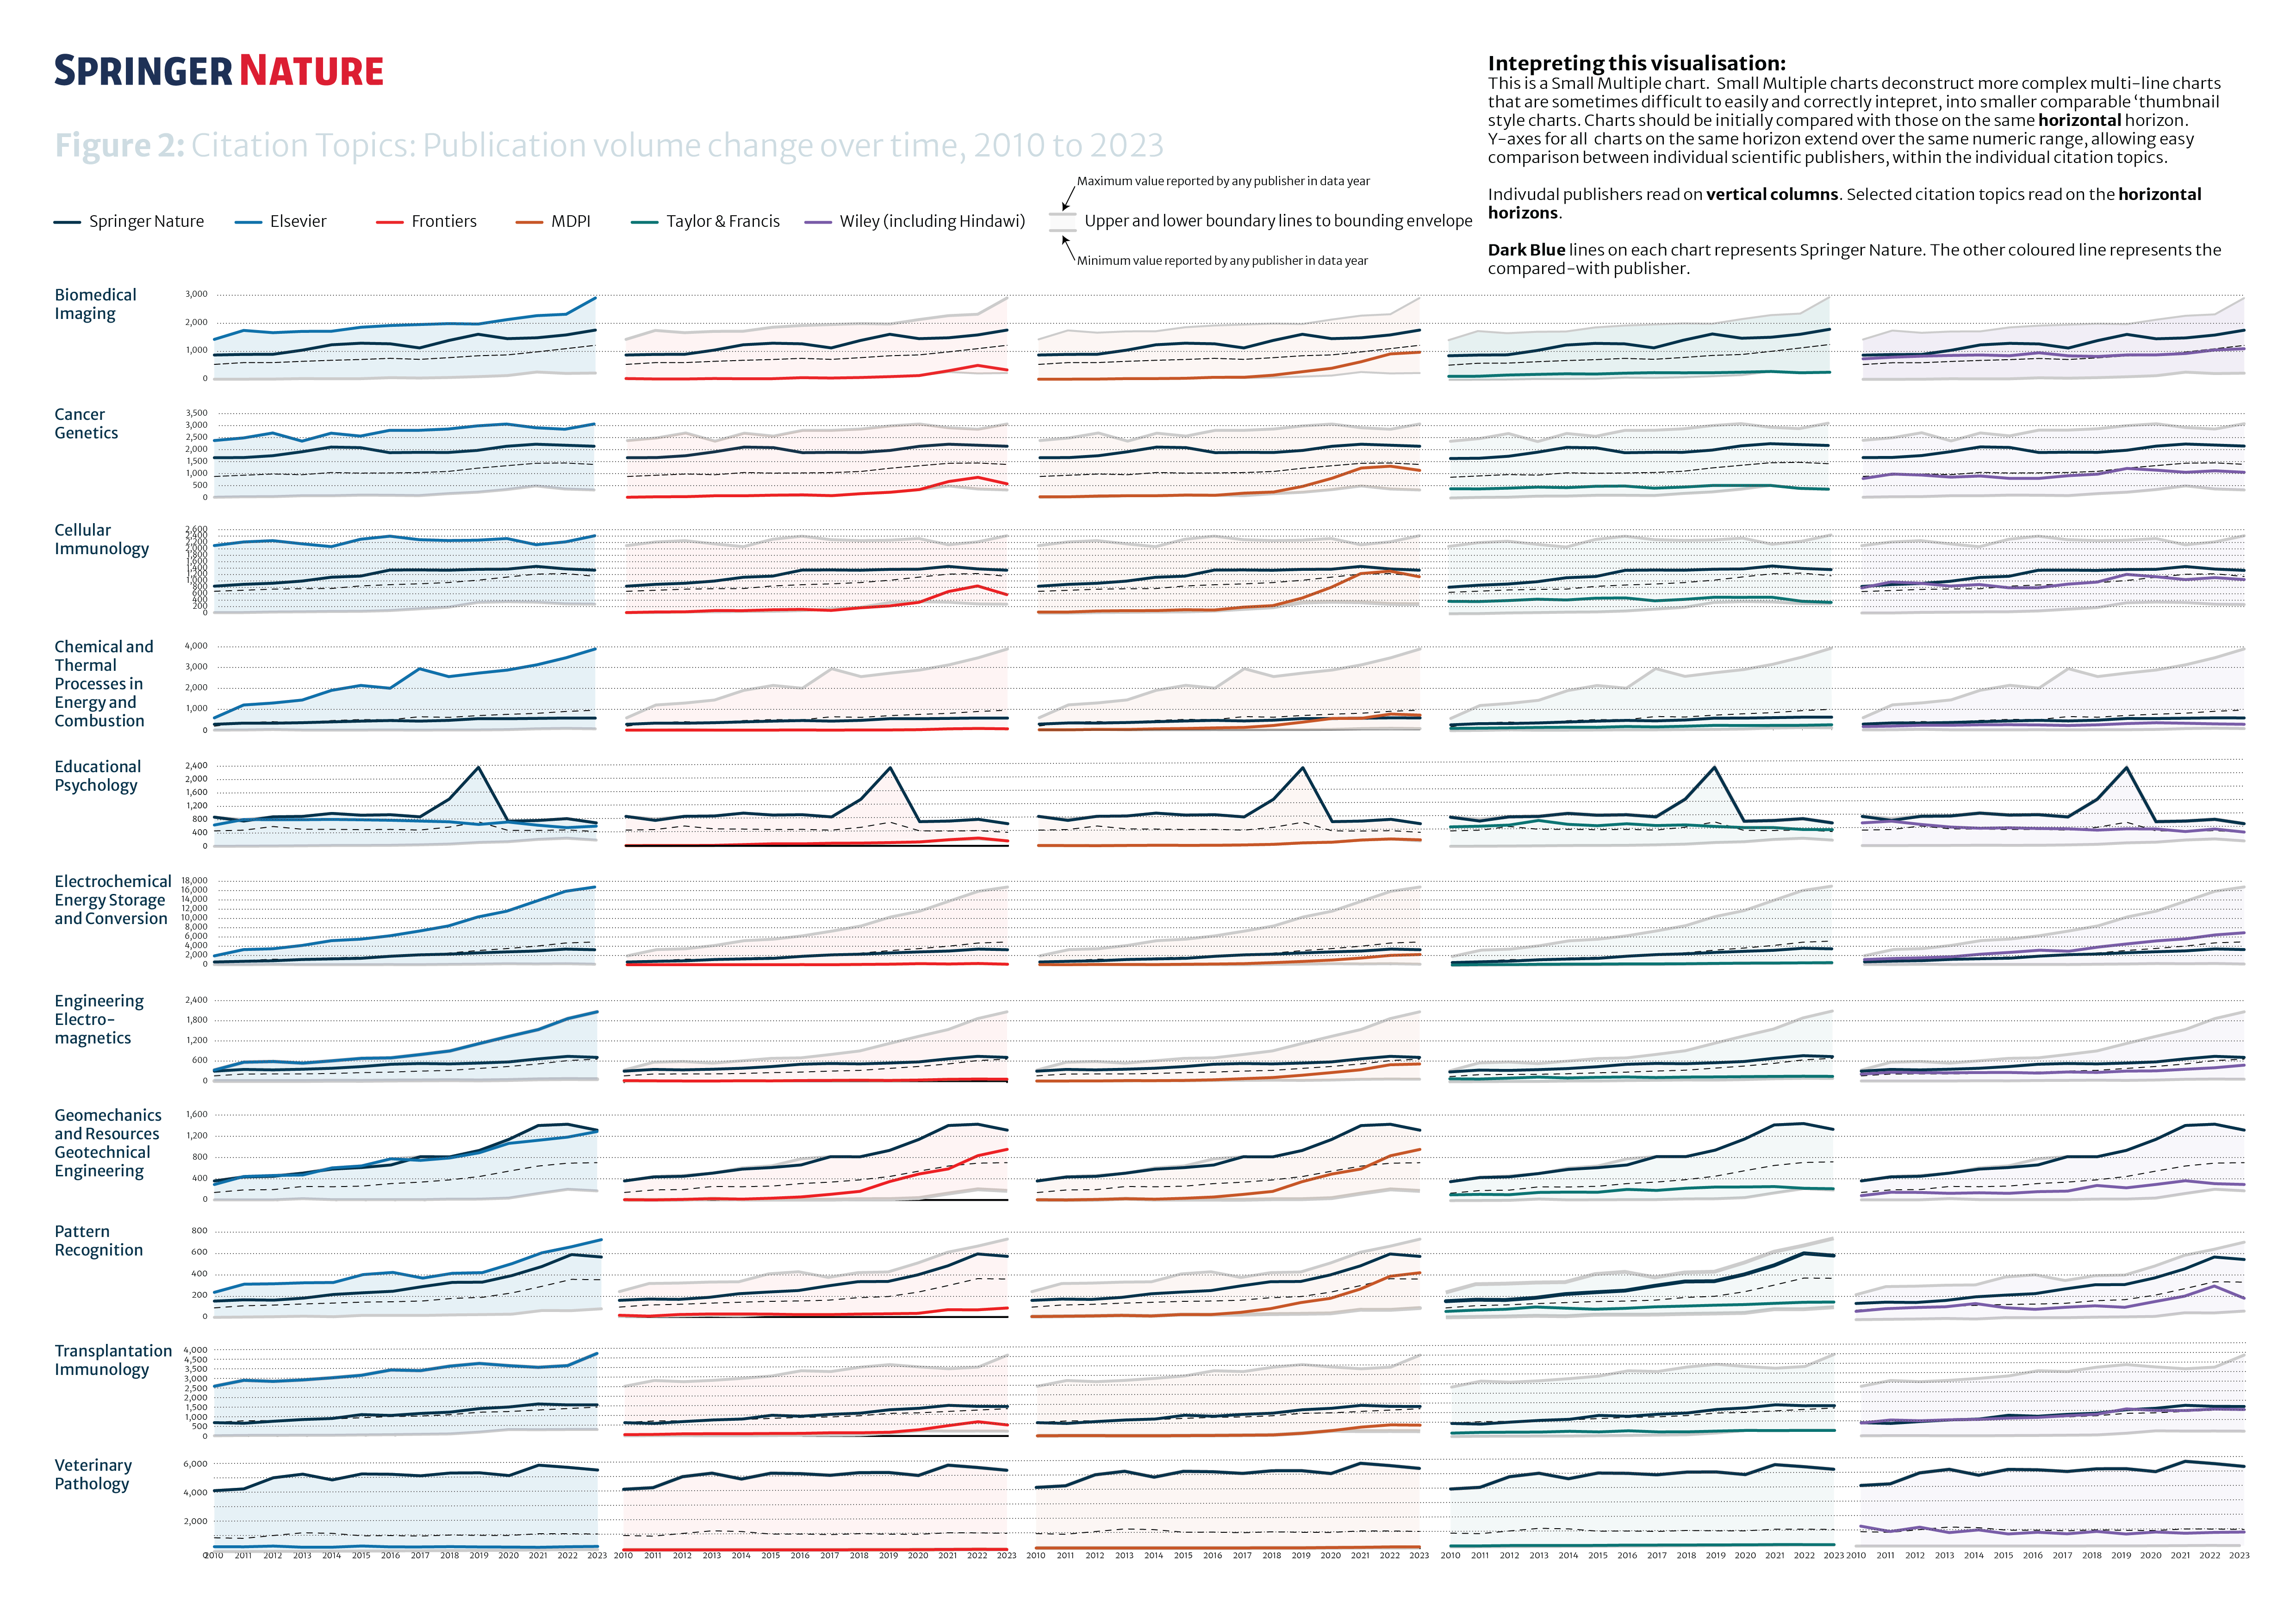
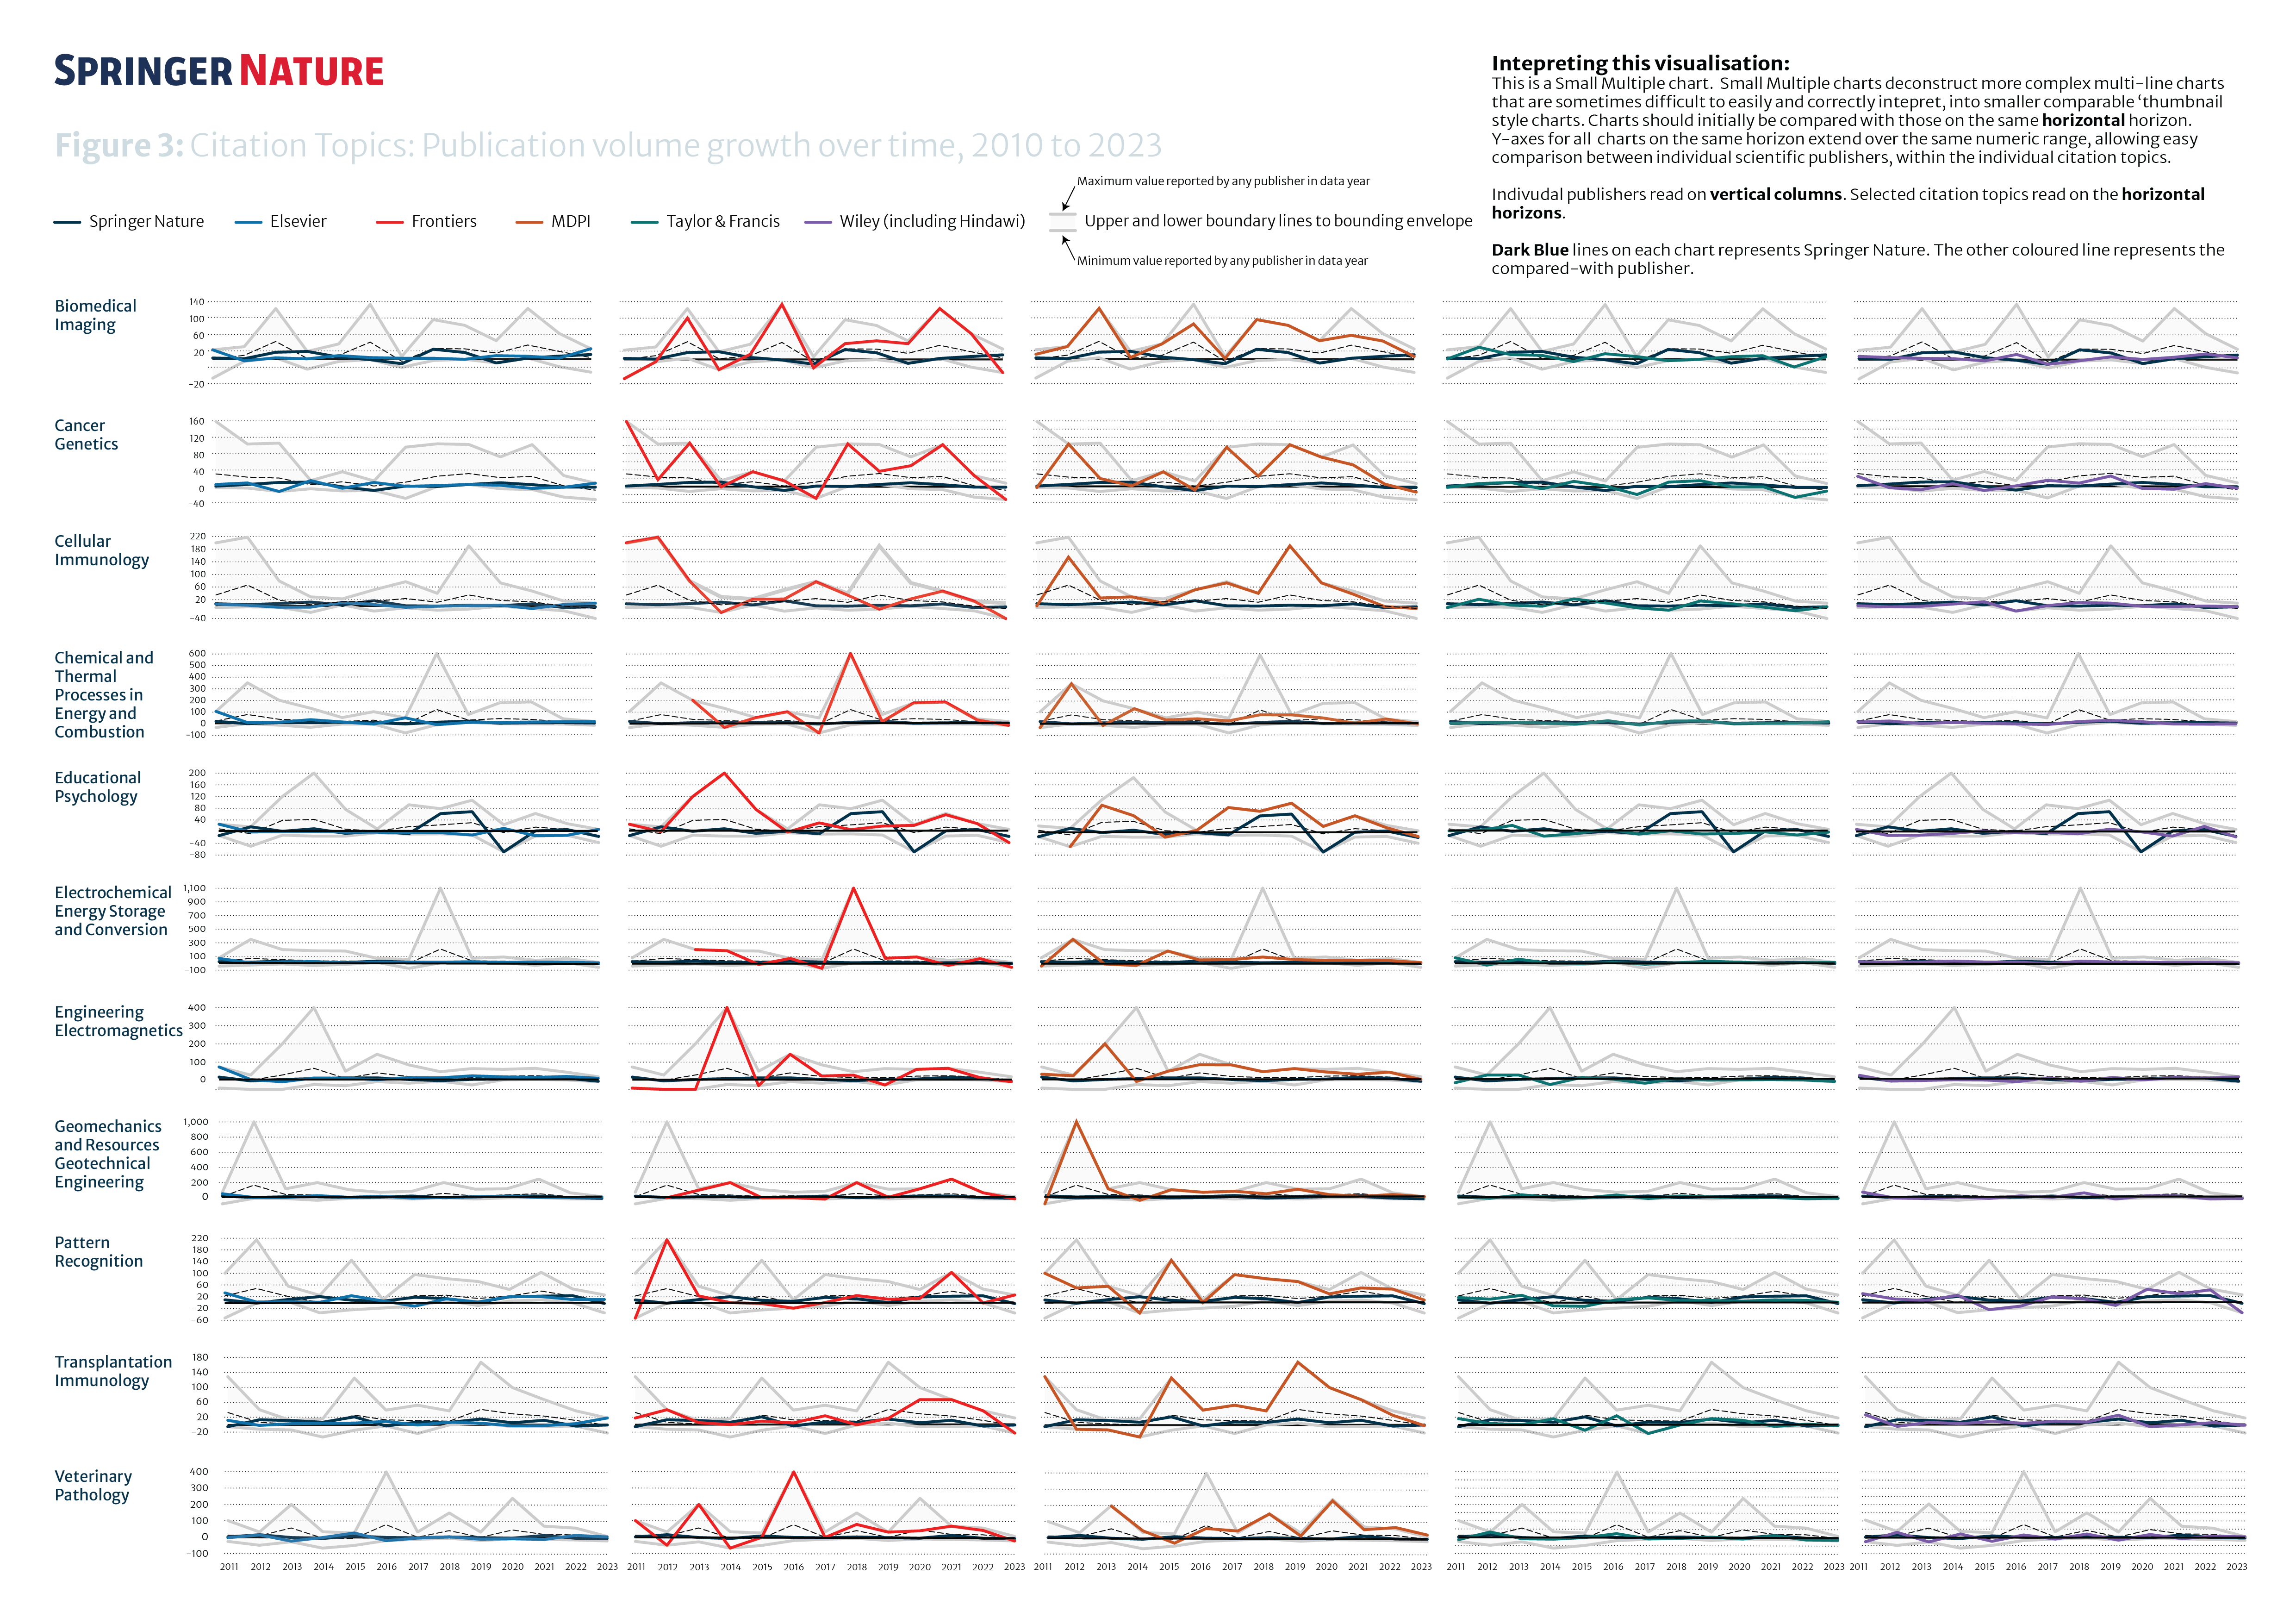
This is a Small Multiple chart. Small Multiple charts deconstruct more complex multi-line charts that are sometimes difficult to easily and correctly intepret, into smaller comparable ‘thumbnail' style charts.
Charts should be initially compared with those on the same horizontal horizon. Y-axes for all charts on the same horizon extend over the same numeric range, allowing easy comparison between individual scientific publishers, within the individual citation topics.
Indivudal publishers read on vertical columns. Selected citation topics read on the horizontal horizons. Dark Blue lines on each chart represents Springer Nature. The other coloured line represents the compared-with publisher.
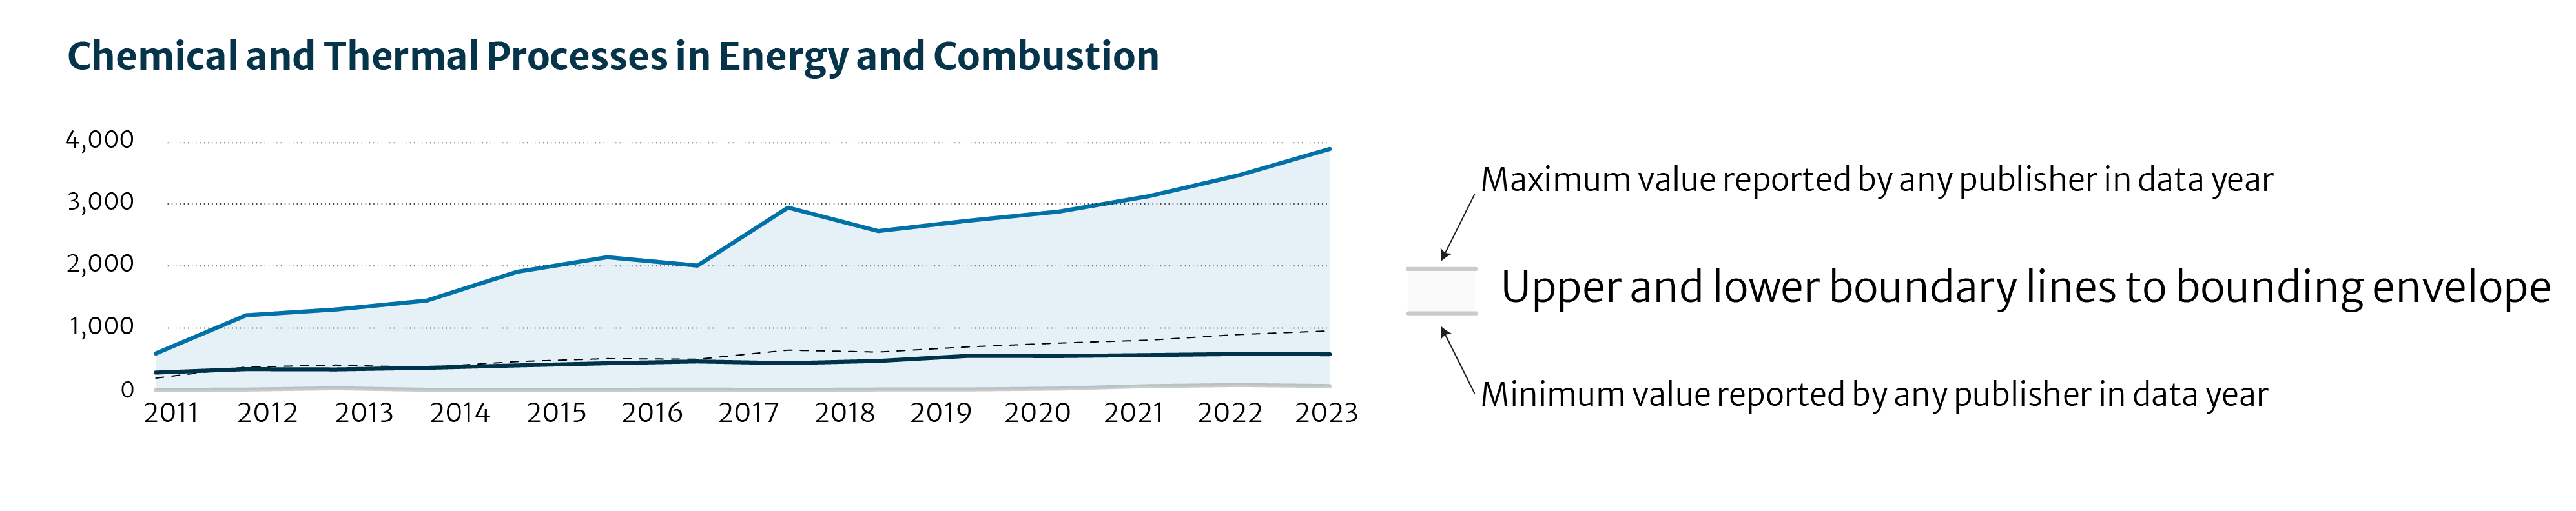
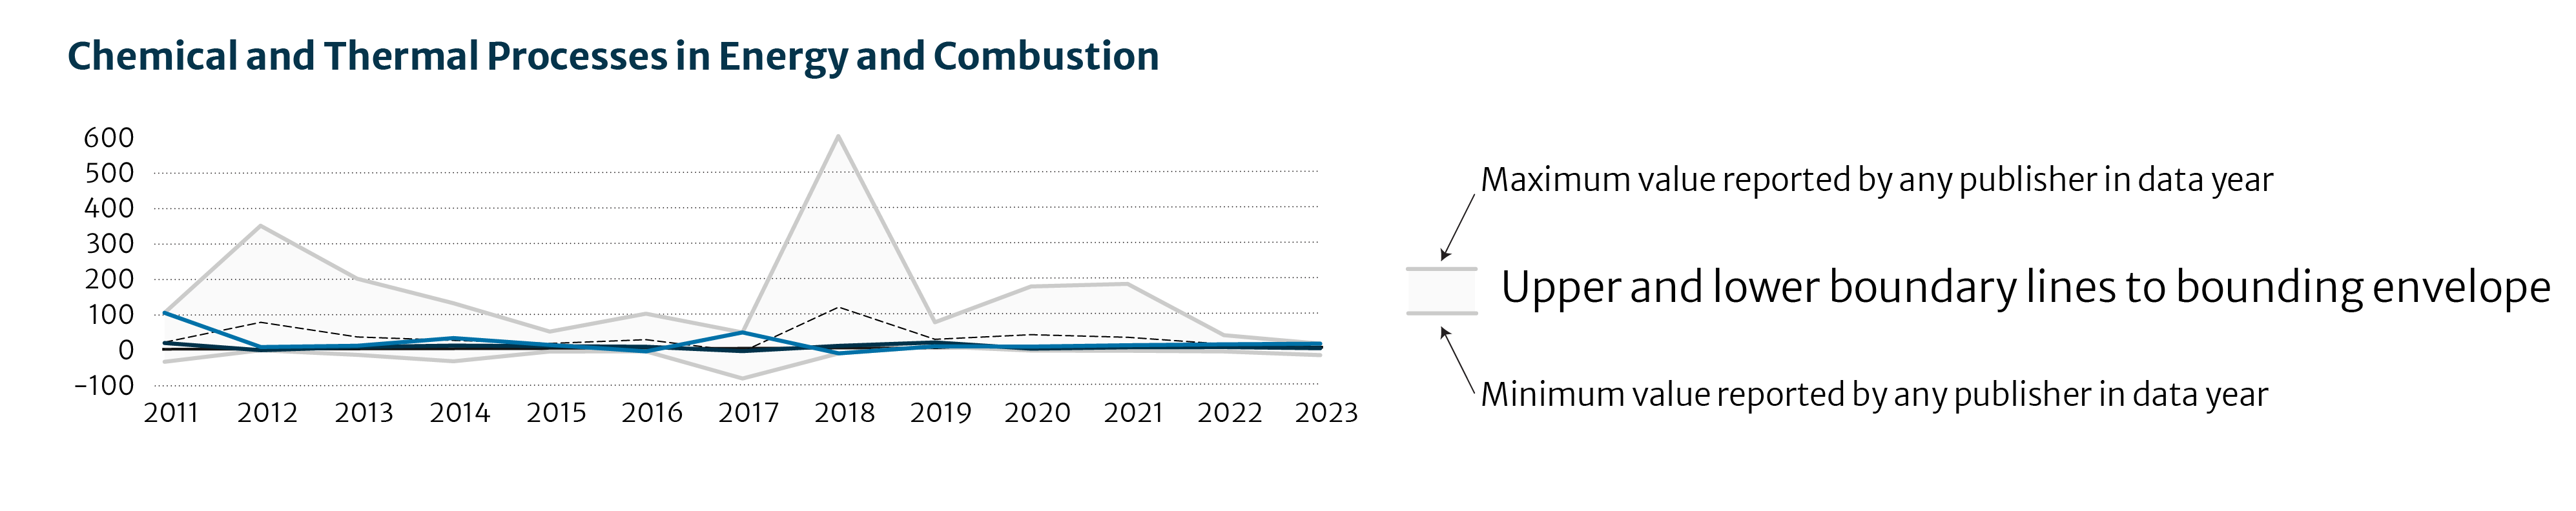
The 'small-multiples' line chart below displaya publication volume growth change over the years 2010-2023. It highlights how the number of publications has changed over time, in this case for the citation topic 'Chemical and Thermal Processes in Energy and Combustion'. While the topic has shown significant growth in the overall market, this trend is not reflected in Springer Nature's performance (as shown in dark blue). The full small multiples visualisation from which this chart comes can be seen in the lower illustration as Figure 2.
This is a Small Multiple chart. Small Multiple charts deconstruct more complex multi-line charts that are sometimes difficult to easily and correctly intepret, into smaller comparable ‘thumbnail' style charts.
Charts should be initially compared with those on the same horizontal horizon. Y-axes for all charts on the same horizon extend over the same numeric range, allowing easy comparison between individual scientific publishers, within the individual citation topics.
Indivudal publishers read on vertical columns. Selected citation topics read on the horizontal horizons. Dark Blue lines on each chart represents Springer Nature. The other coloured line represents the compared-with publisher.
The 'small-multiples' line chart below displaya publication volume growth change over the years 2010-2023. It highlights how the number of publications has changed over time, in this case for the citation topic 'Chemical and Thermal Processes in Energy and Combustion'. While the topic has shown significant growth in the overall market, this trend is not reflected in Springer Nature's performance (as shown in dark blue). The full small multiples visualisation from which this chart comes can be seen in the lower illustration as Figure 2.
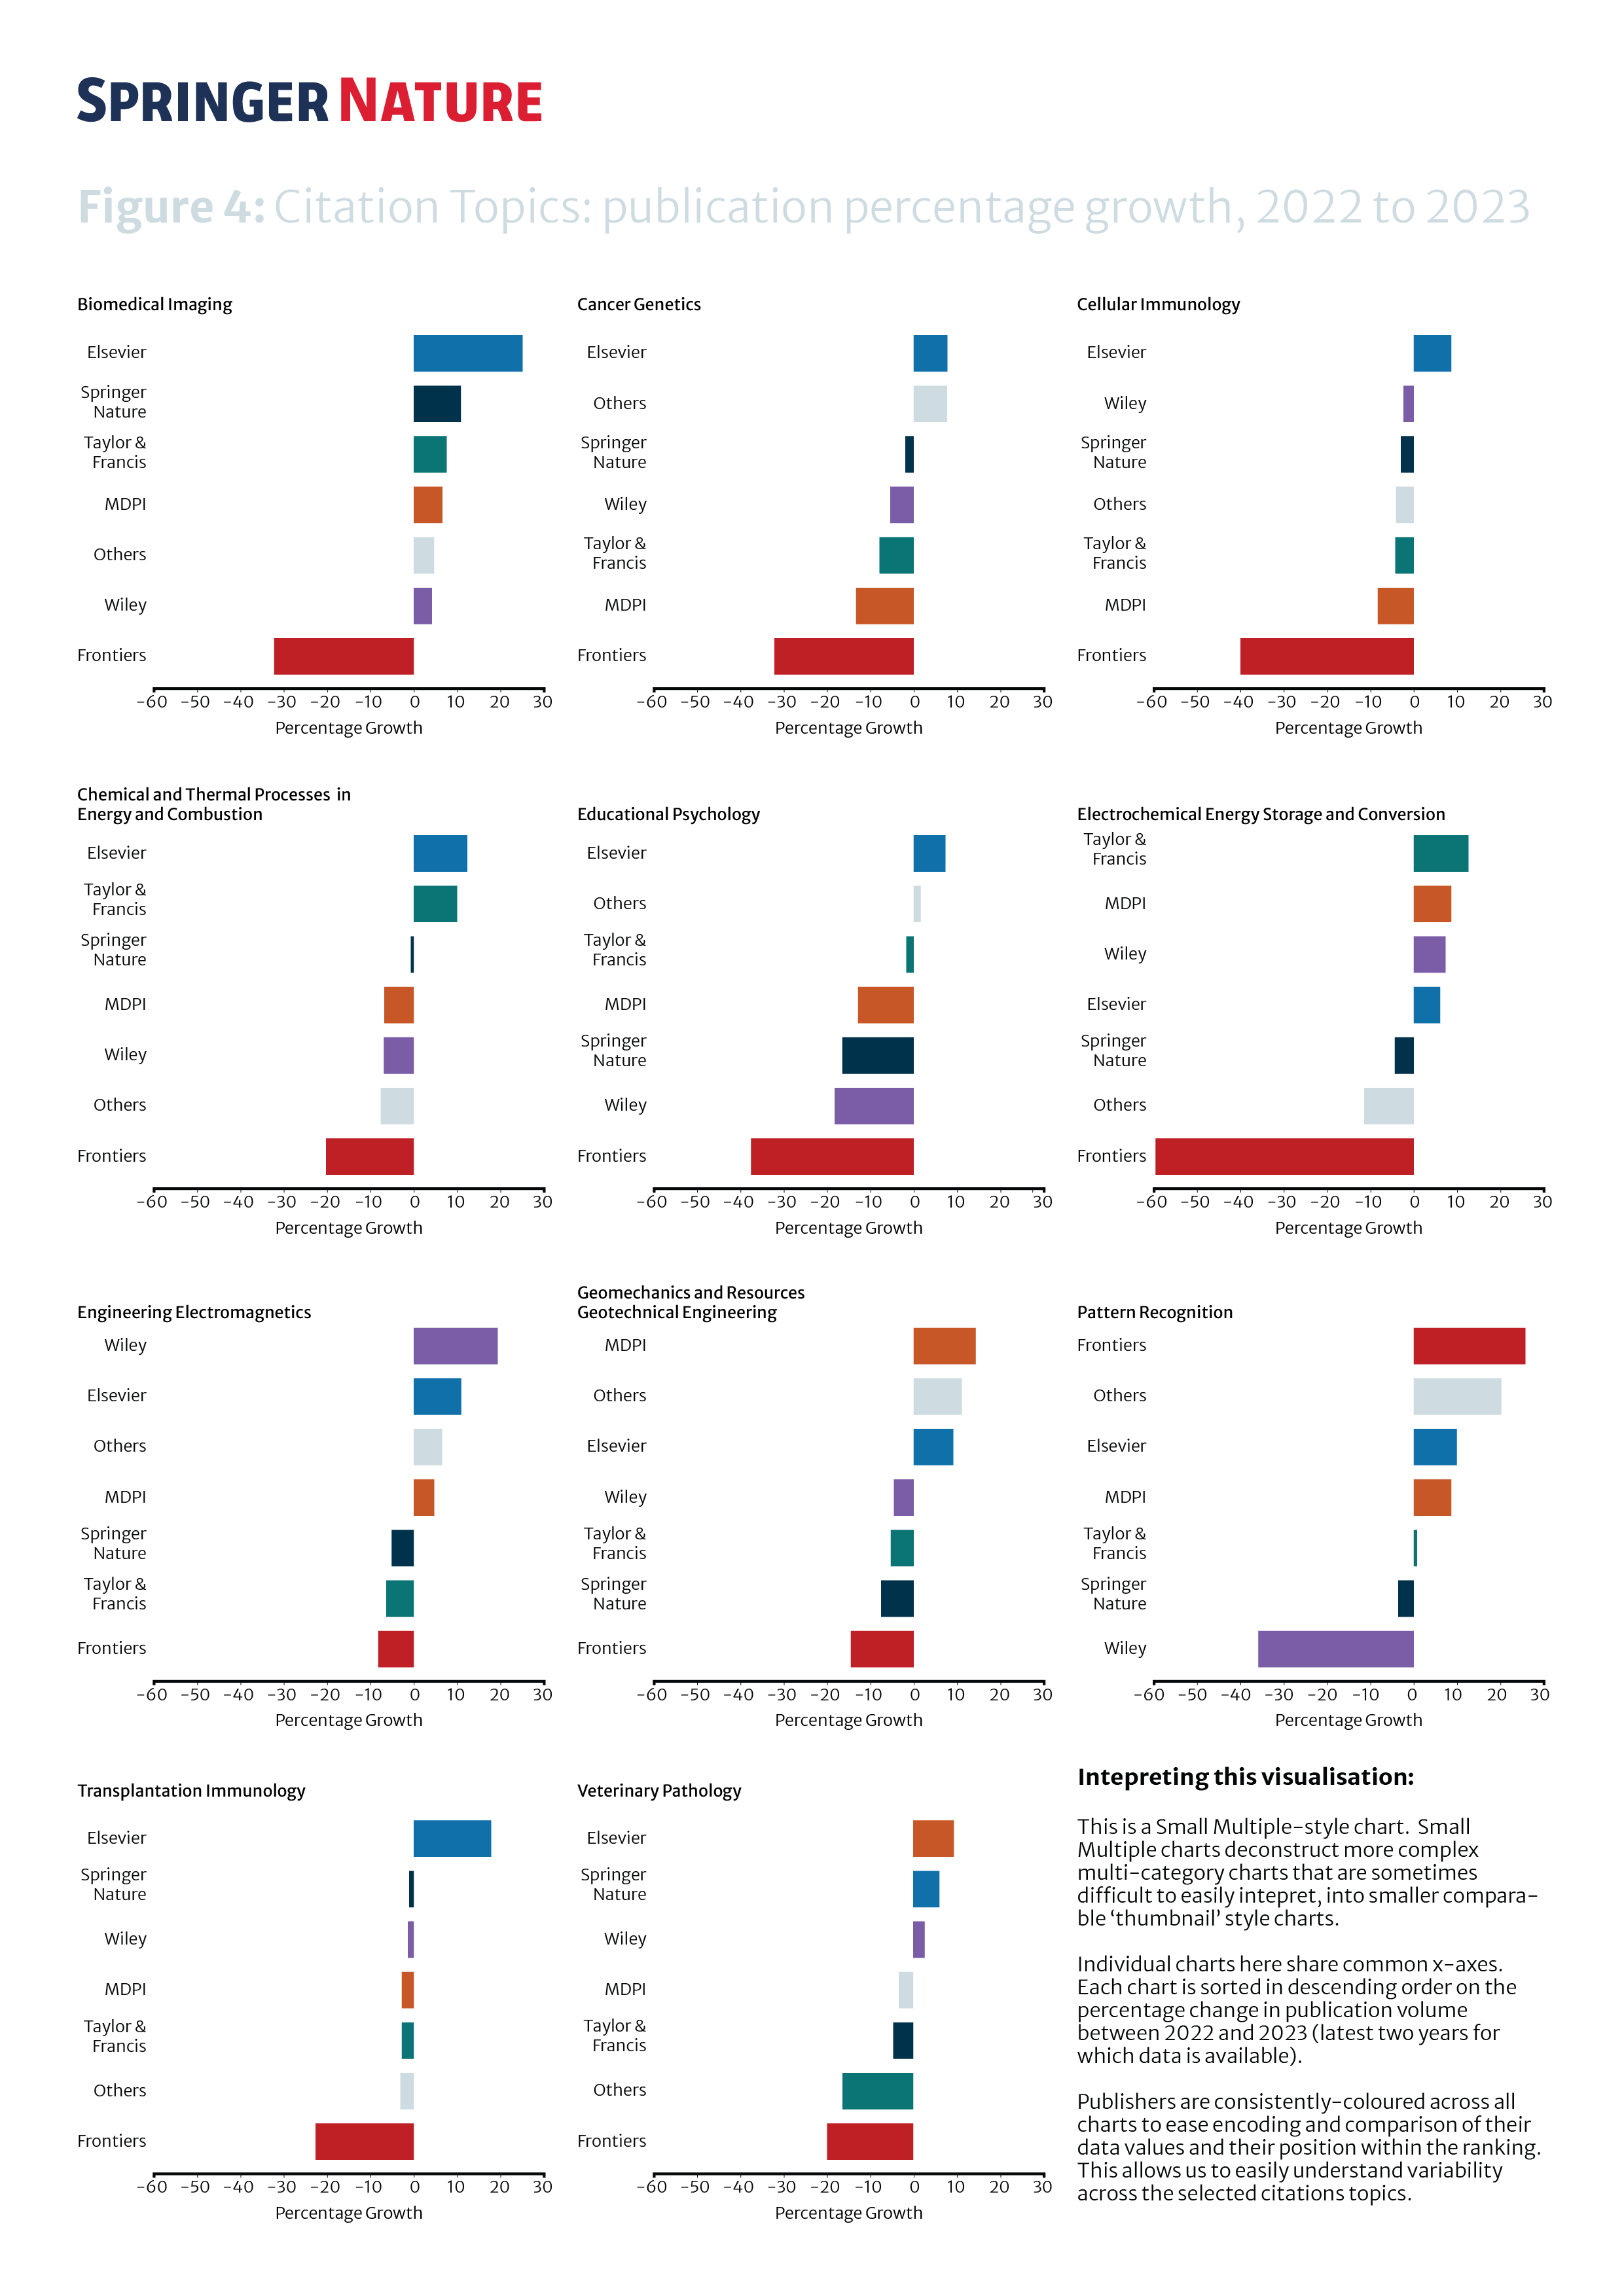
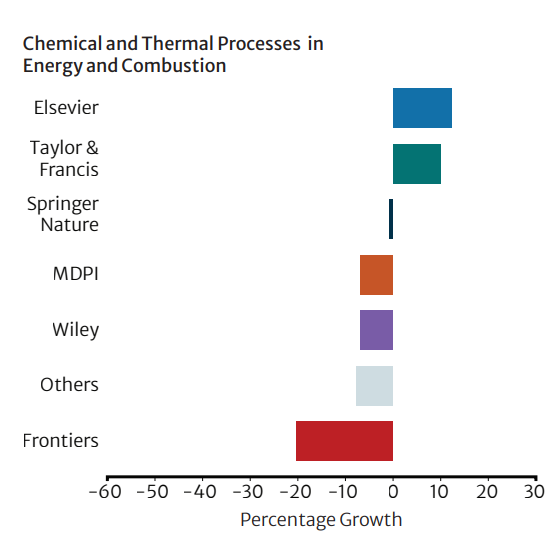
The bar chart (Figure 4) displays the growth percentage in 2023 compared to 2022, showing that for Springer Nature growth is negative at -0.7% whereas for Elsevier growth is 12.3%.
This is a Small Multiple-style chart. Small Multiple charts deconstruct more complex multi-category charts that are sometimes difficult to easily intepret, into smaller comparable ‘thumbnail’ style charts. Individual charts here share common x-axes. Each chart is sorted in descending order on the percentage change in publication volume between 2022 and 2023 (latest two years for which data is available). Publishers are consistently-coloured across all charts to ease encoding and comparison of their data values and their position within the ranking. This allows us to easily understand variability across the selected citations topics.
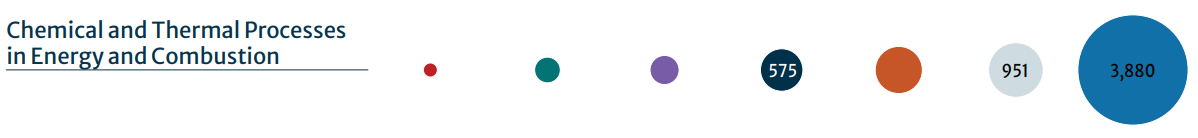
As we look at the charts in Figures 5 and 6, in 2023, Springer Nature lags in this topic area, with 575 articles and publication volumes substantially below the annual mean (shown in light gray) of 951 articles. Elsevier published a substantial 3,880 articles, dominating the market and highlighting the gap in market share in this topic.”
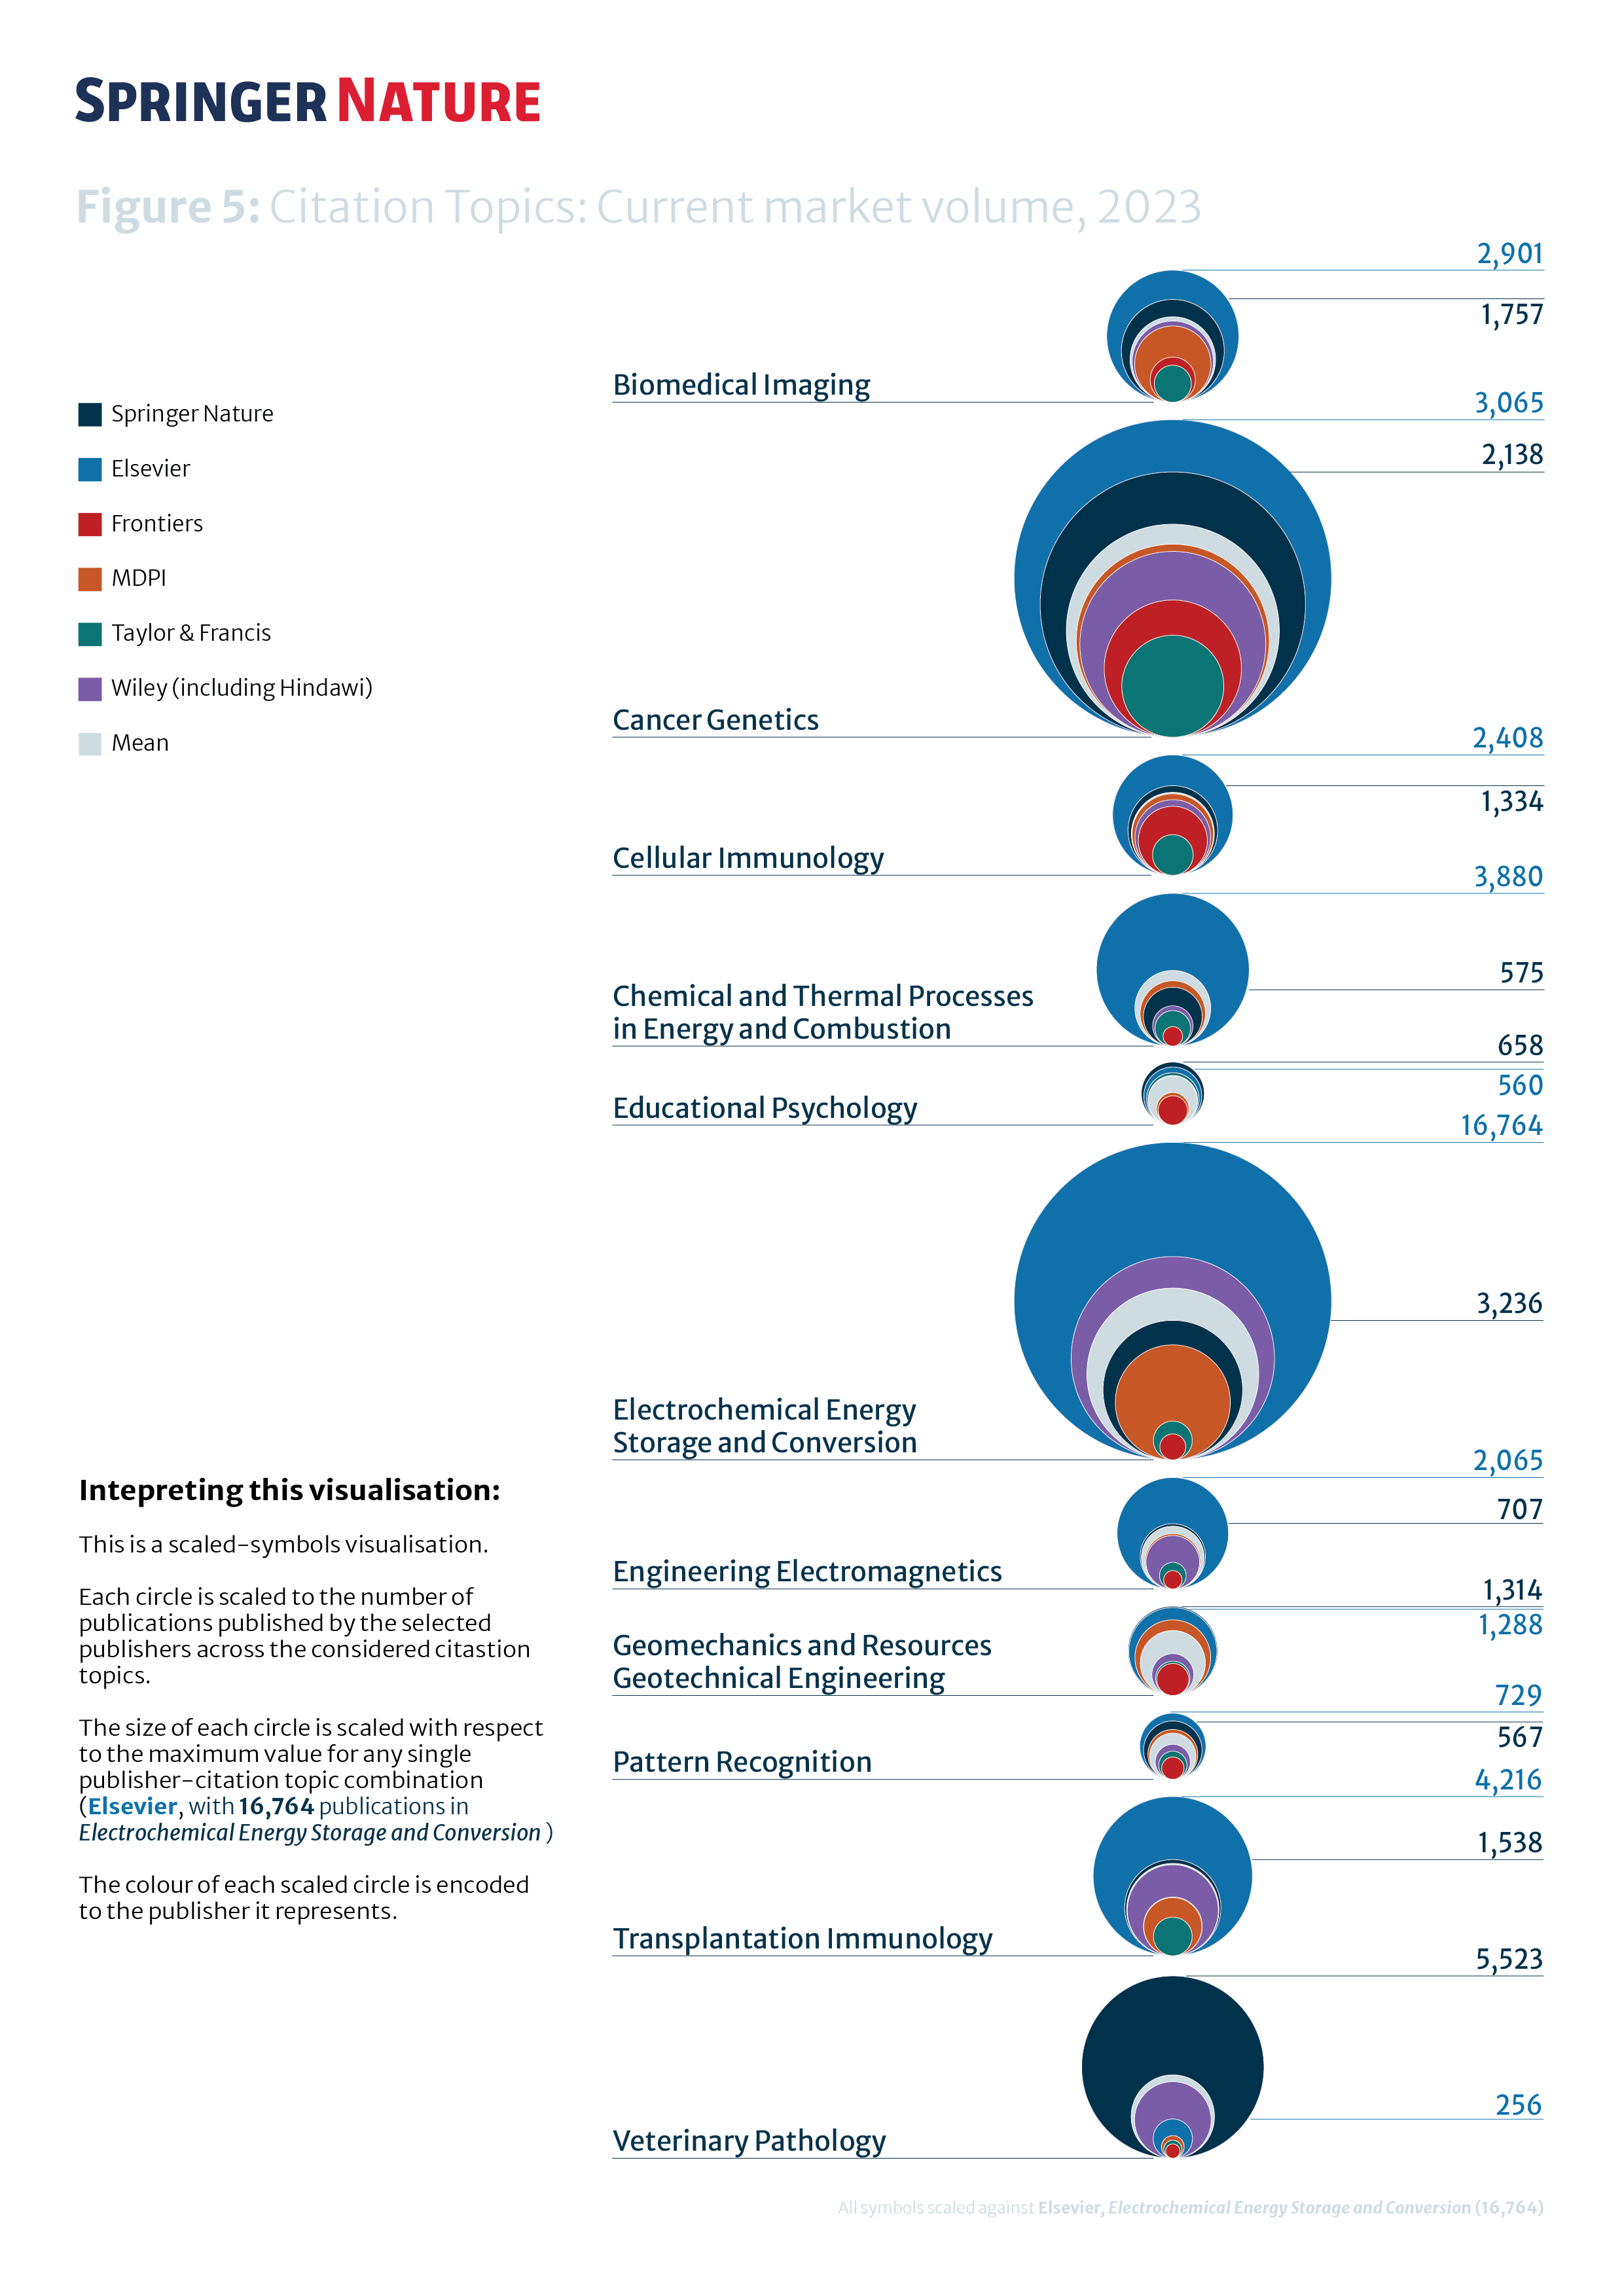
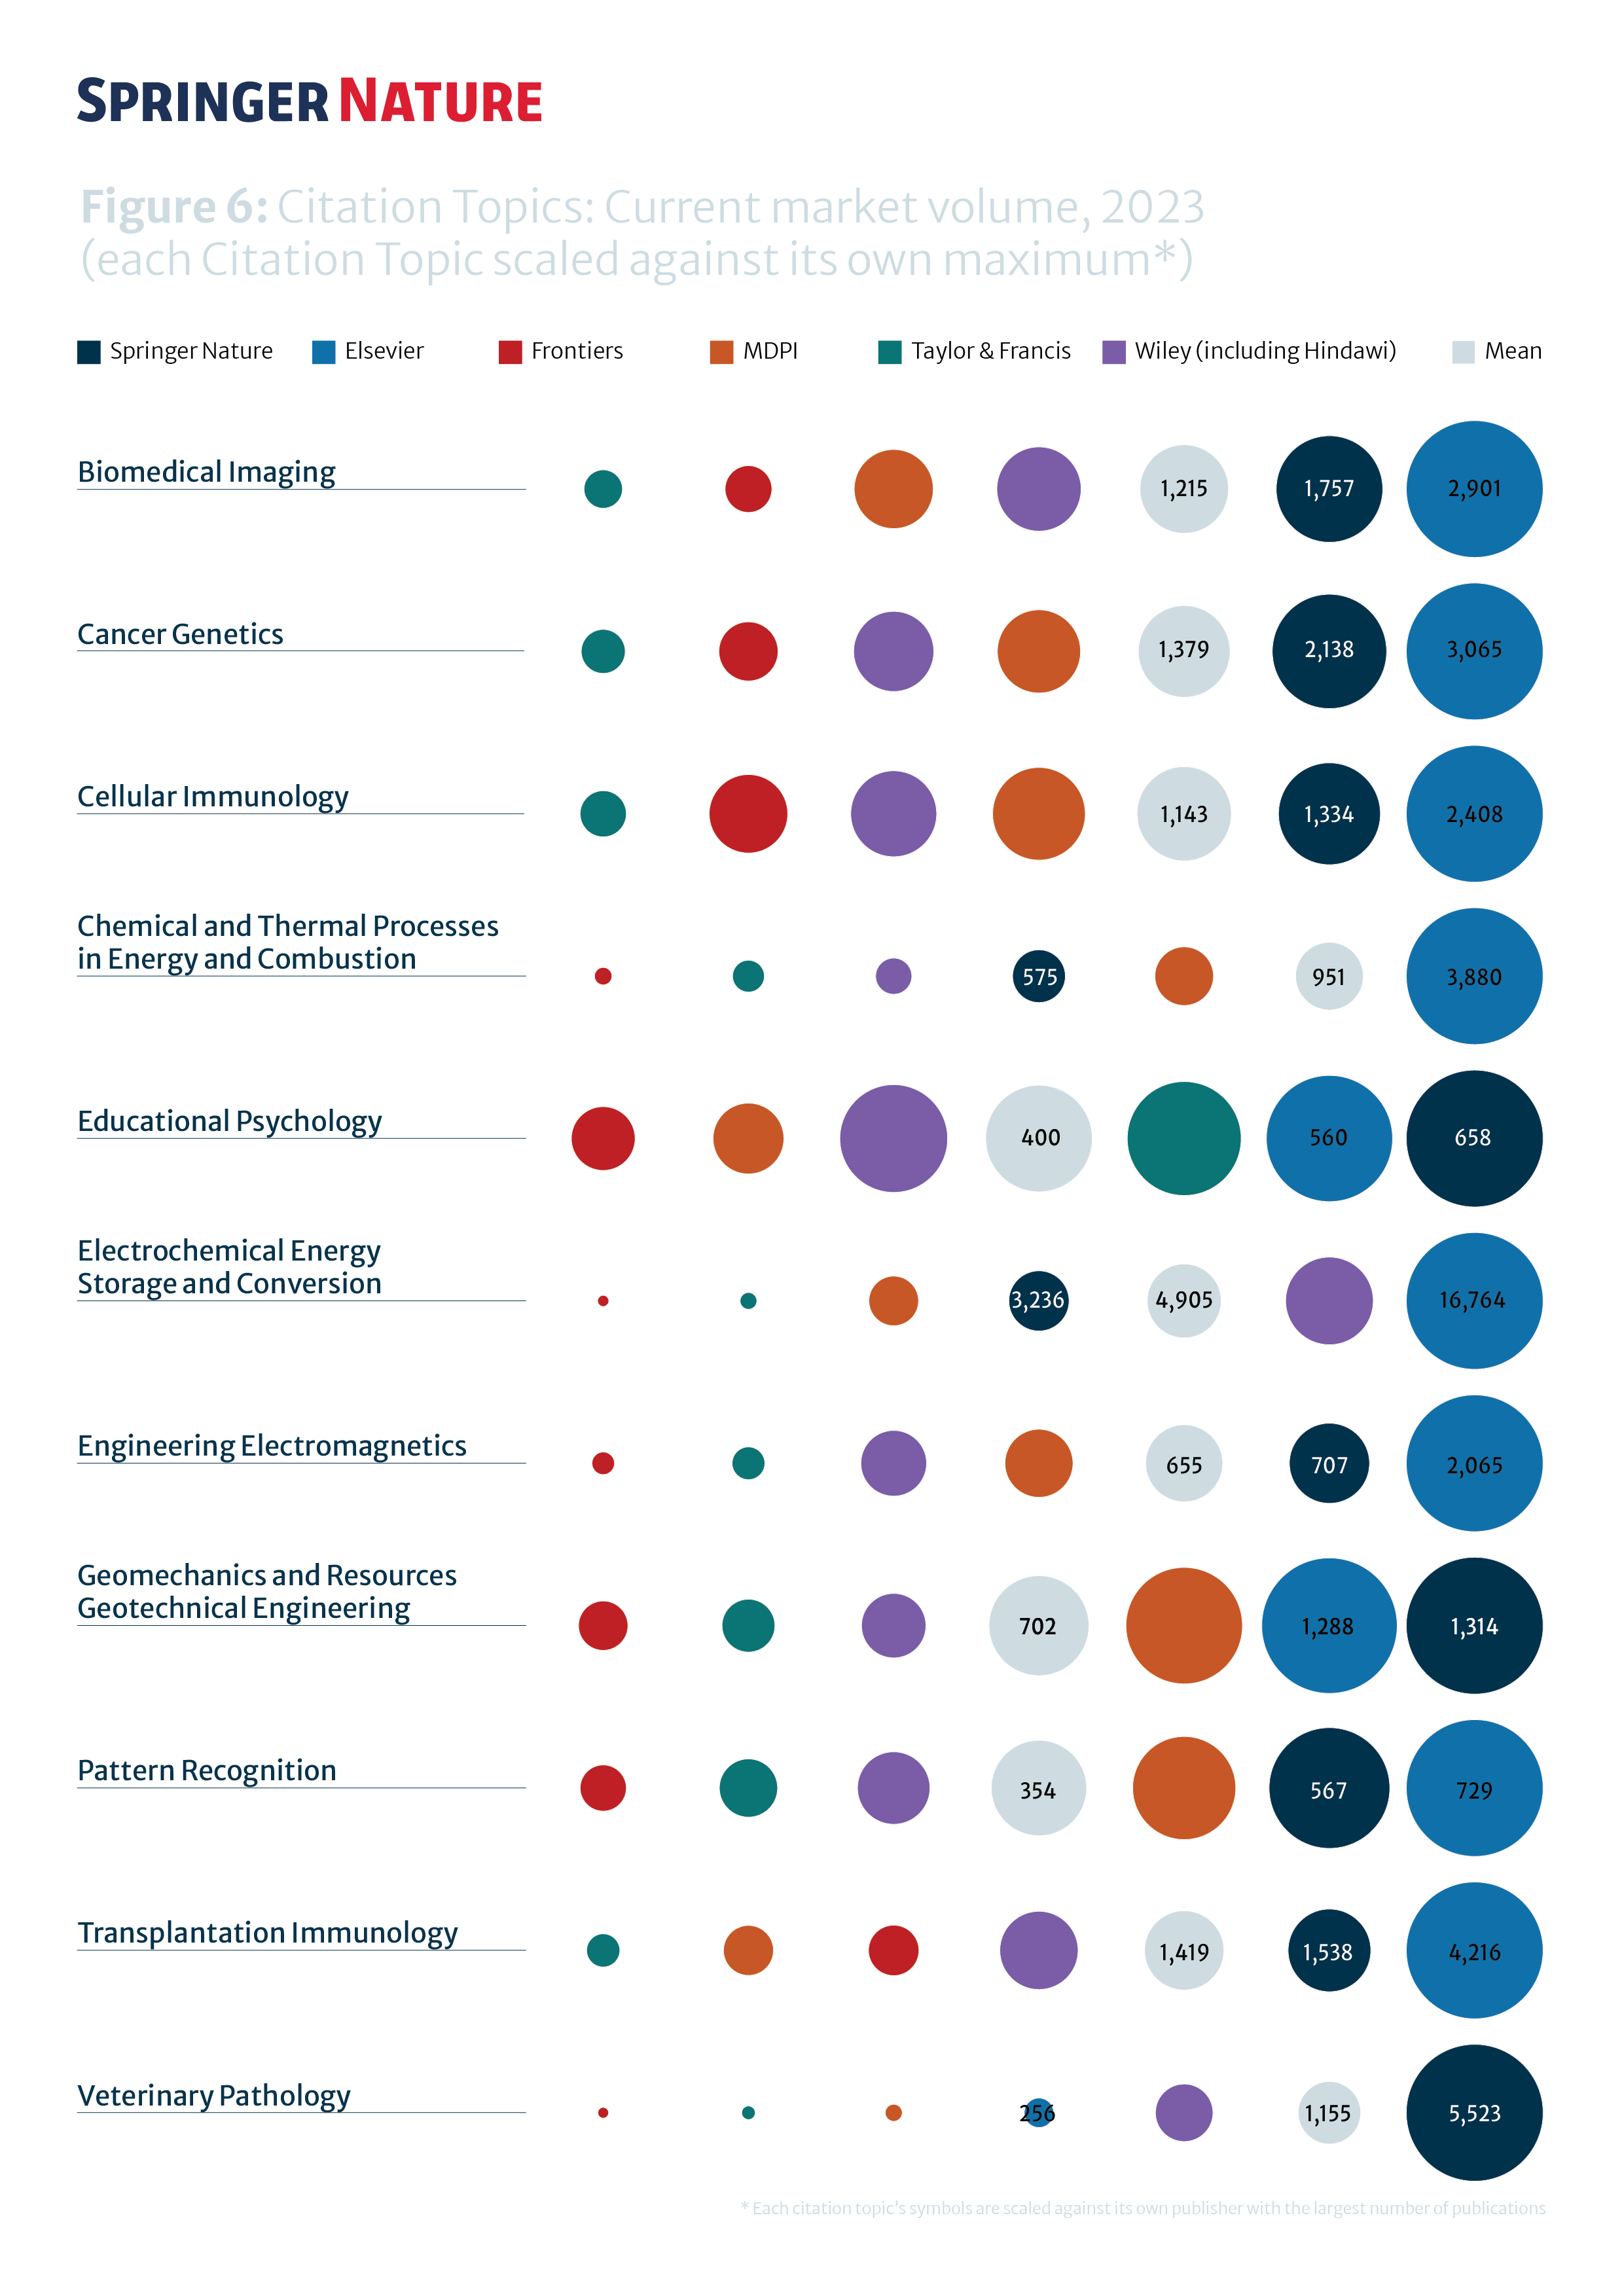
This is a scaled-symbols visualisation. Each circle is scaled to
the number of publications published by the selected publishers
across the considered citastion topics.
The size of each circle is scaled with respect to the
maximum value for any single publisher-citation topic
combination (Elsevier, with 16,764 publications in
Electrochemical Energy Storage and Conversion) The colour of
each scaled circle is encoded to the publisher it represents.
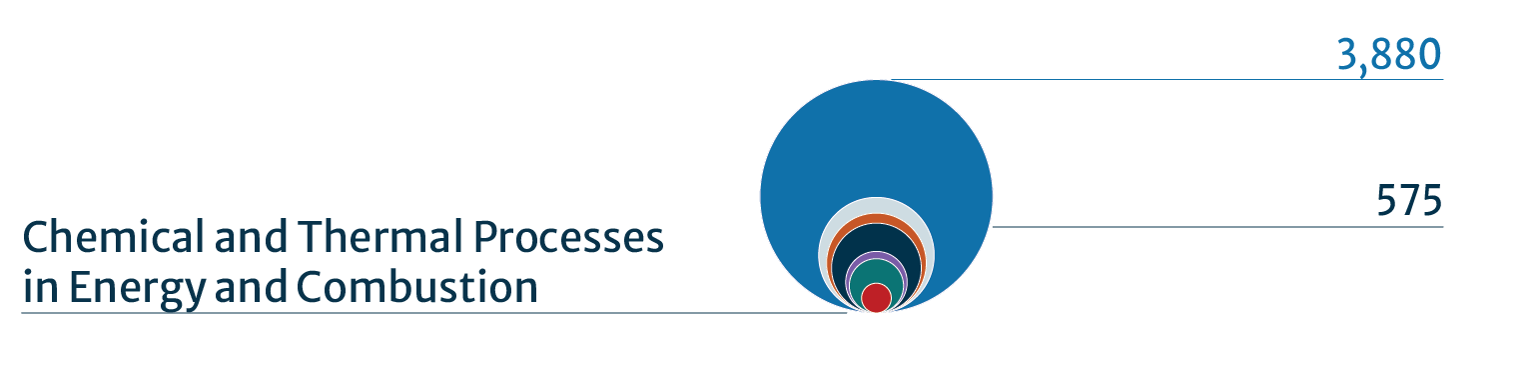
As we look at the charts in both Figures 5 and 6, in 2023, Springer Nature lags in this topic area, with 575 articles and publication volumes substantially below the annual mean (shown in light gray) of 951 articles. Elsevier published a substantial 3,880 articles, dominating the market and highlighting the gap in market share in this topic.”
See our data in a new light


Nature Research Intelligence
Data & Analytics Solutions
© 2024 Springer Nature Limited