Impact Solutions 2025 End-Of-Year Review In Numbers
Published
December 2025
Contributors
Wojtek Urbanek (Creative Team, Impact Solutions - Creative Director)
Stephen Pincock (Impact Solutions - EVP)
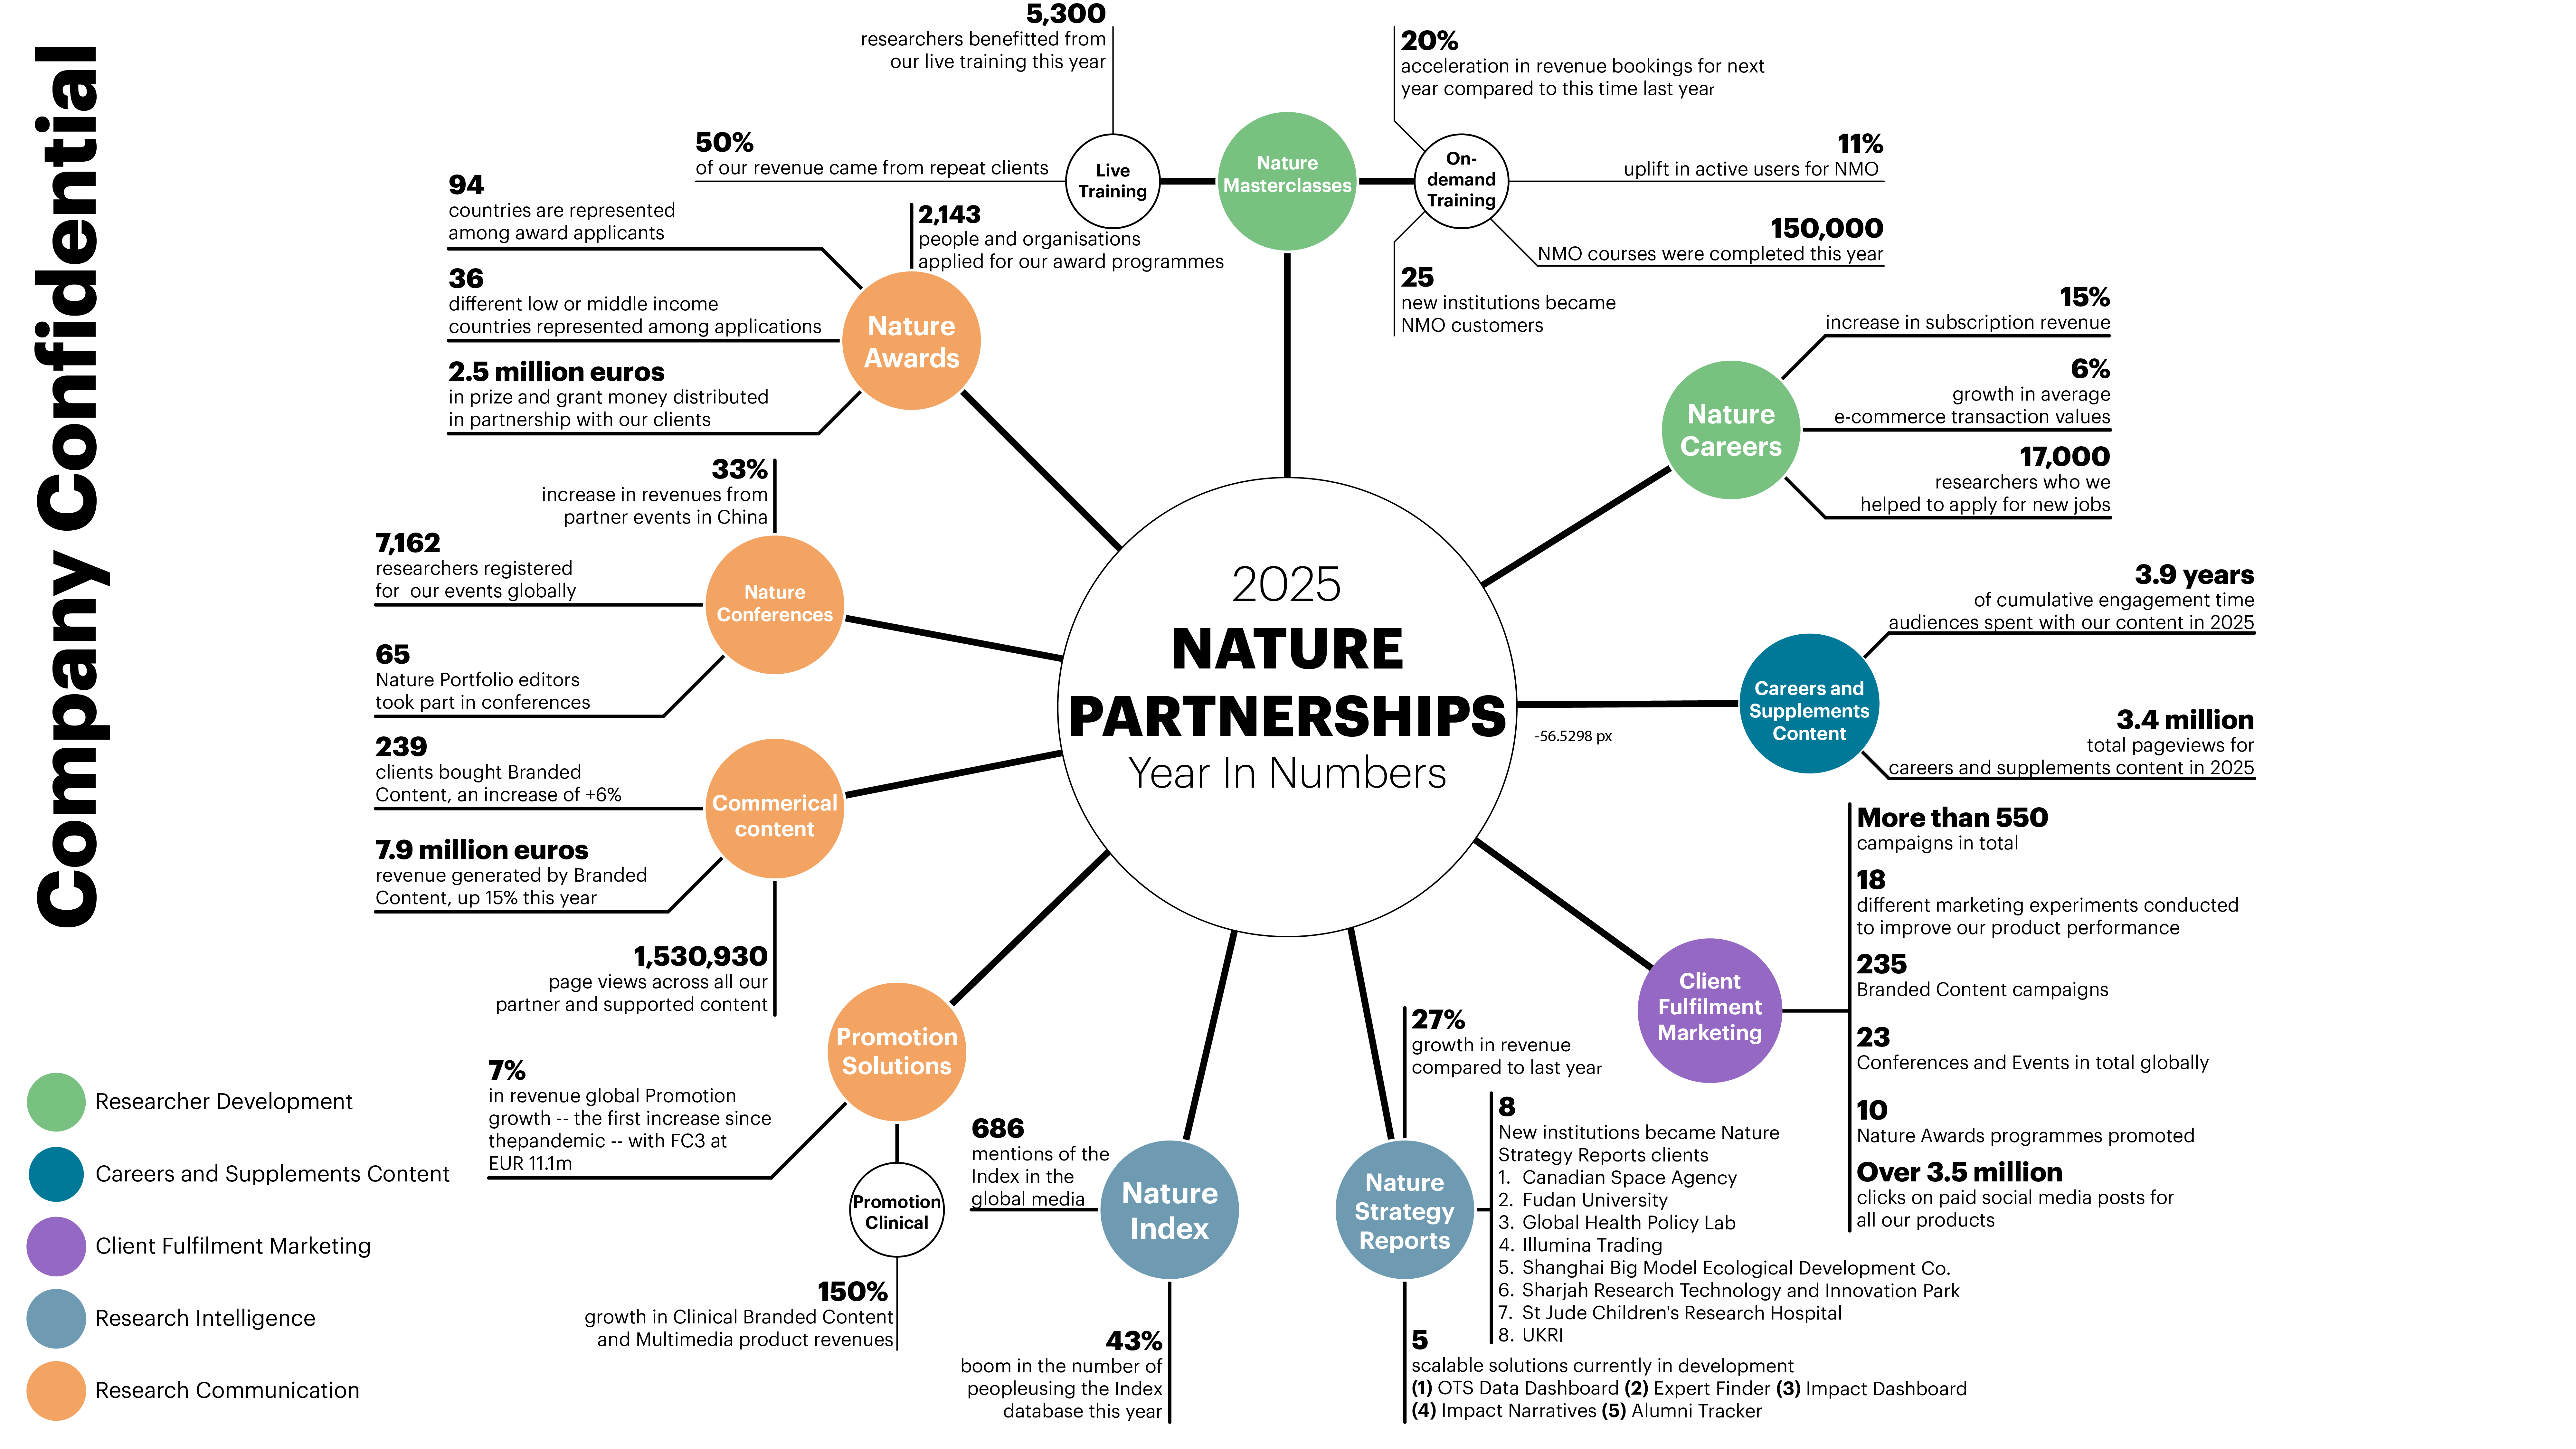
The data visualisation project presented beyond this panel is an infographic developed specifically for the Division’s End of Year Review, designed to both retrospectively reflect on the past 12 months and to look ahead to the year to come. Its primary purpose is to provide a clear, visually engaging summary of key successes achieved by individual teams across the Division, distilling complex activity and performance into an accessible, high-level overview. By bringing these achievements together in a single, coherent visual format, the infographic supports shared understanding, celebration of progress, and strategic reflection.
To achieve this, a simple radial hub-and-spoke network design has been adopted. At the centre, the hub represents the Division as a whole, while each spoke radiates outward to highlight the contributions and accomplishments of individual teams. This structure reinforces both the independence of each team’s achievements and their collective role within the broader organisational context. The clean, balanced layout enables viewers to quickly compare areas of success, identify patterns at a glance, and appreciate how diverse activities connect back to shared divisional goals.
See our data in a new light


Nature Research Intelligence
Data & Analytics Solutions
© 2024 Springer Nature Limited